Technical Analysis of FTCS 2024-05-10
Overview:
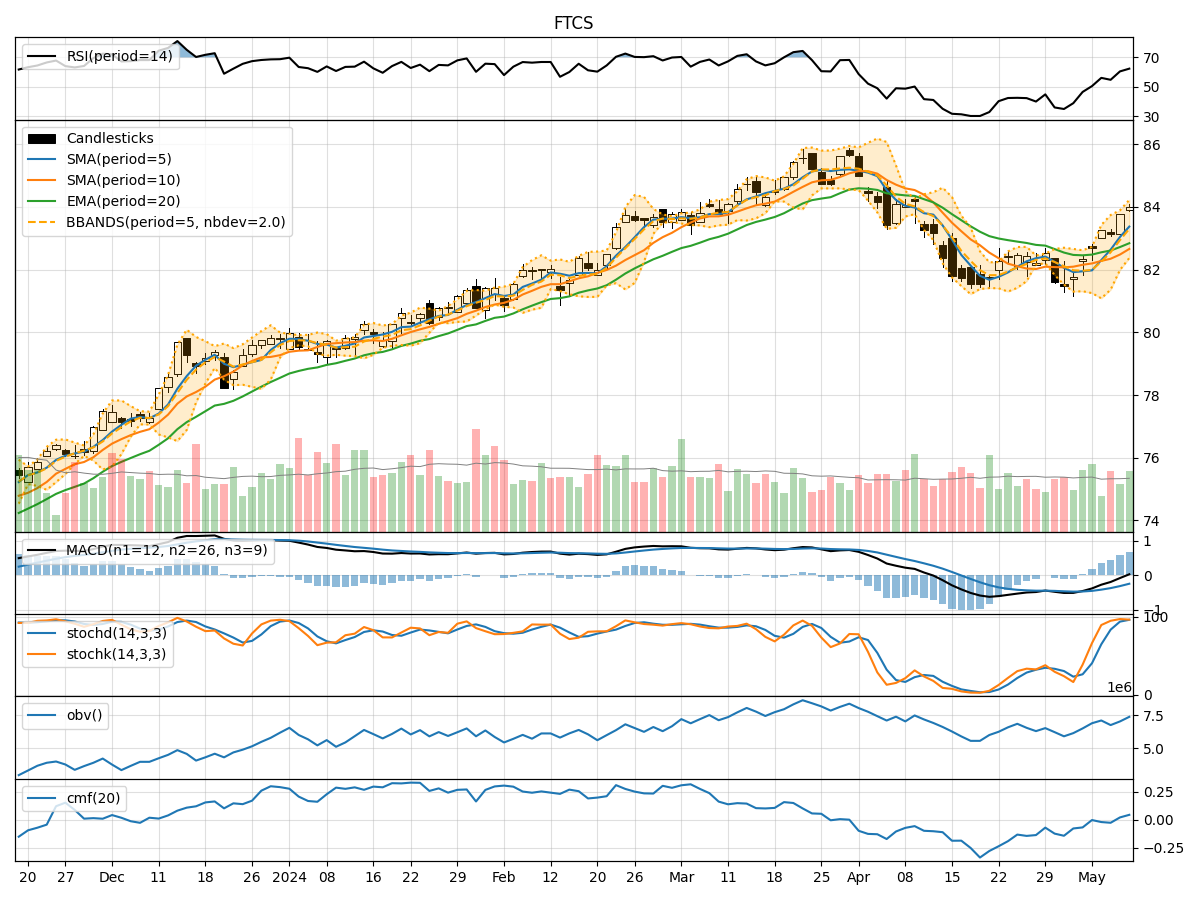
In analyzing the technical indicators for the stock FTCS over the last 5 days, we will delve into the trends, momentum, volatility, and volume indicators to provide a comprehensive outlook on the possible stock price movement in the coming days.
Trend Indicators:
- Moving Averages (MA): The 5-day Moving Average has been consistently rising, indicating a bullish trend in the short term.
- MACD: The MACD line has been above the signal line for the past few days, suggesting a bullish momentum.
- EMA: The Exponential Moving Average has also been trending upwards, supporting the bullish sentiment.
Momentum Indicators:
- RSI: The Relative Strength Index has been increasing, showing strengthening buying momentum.
- Stochastic Oscillator: Both %K and %D have been in the overbought zone, indicating a strong bullish momentum.
- Williams %R: The indicator has been hovering in the oversold territory, suggesting a potential reversal to the upside.
Volatility Indicators:
- Bollinger Bands: The stock price has been trading within the upper Bollinger Band, indicating high volatility and a potential continuation of the uptrend.
- Bollinger %B: The %B indicator has been above 0.8, signifying an overbought condition.
Volume Indicators:
- On-Balance Volume (OBV): The OBV has been increasing, reflecting higher buying volume in the stock.
- Chaikin Money Flow (CMF): The CMF has been positive, indicating a bullish money flow into the stock.
Key Observations and Opinions:
- Trend: The stock is in a clear upward trend supported by moving averages and MACD.
- Momentum: Momentum indicators like RSI and Stochastic Oscillator suggest strong buying momentum.
- Volatility: High volatility as indicated by Bollinger Bands could lead to further price fluctuations.
- Volume: Increasing OBV and positive CMF signal healthy buying interest in the stock.
Conclusion:
Based on the analysis of the technical indicators, the next few days are likely to see the stock price of FTCS continue its upward movement. The bullish trend, strong momentum, positive volume flow, and high volatility suggest that the stock is poised for further gains. Traders and investors may consider buying opportunities in the stock based on the current technical outlook.
Disclaimer:
This analysis is based solely on technical indicators and historical data. It is important to consider other factors such as market conditions, news, and fundamental analysis before making any investment decisions. Always ensure to conduct thorough research and consult with a financial advisor before trading or investing in the stock market.