Technical Analysis of FTDS 2024-05-10
Overview:
In analyzing the technical indicators for FTDS stock over the last 5 days, we will delve into the trend, momentum, volatility, and volume indicators to provide a comprehensive outlook on the possible stock price movement in the coming days. By examining these key indicators, we aim to offer valuable insights and predictions for potential investors.
Trend Analysis:
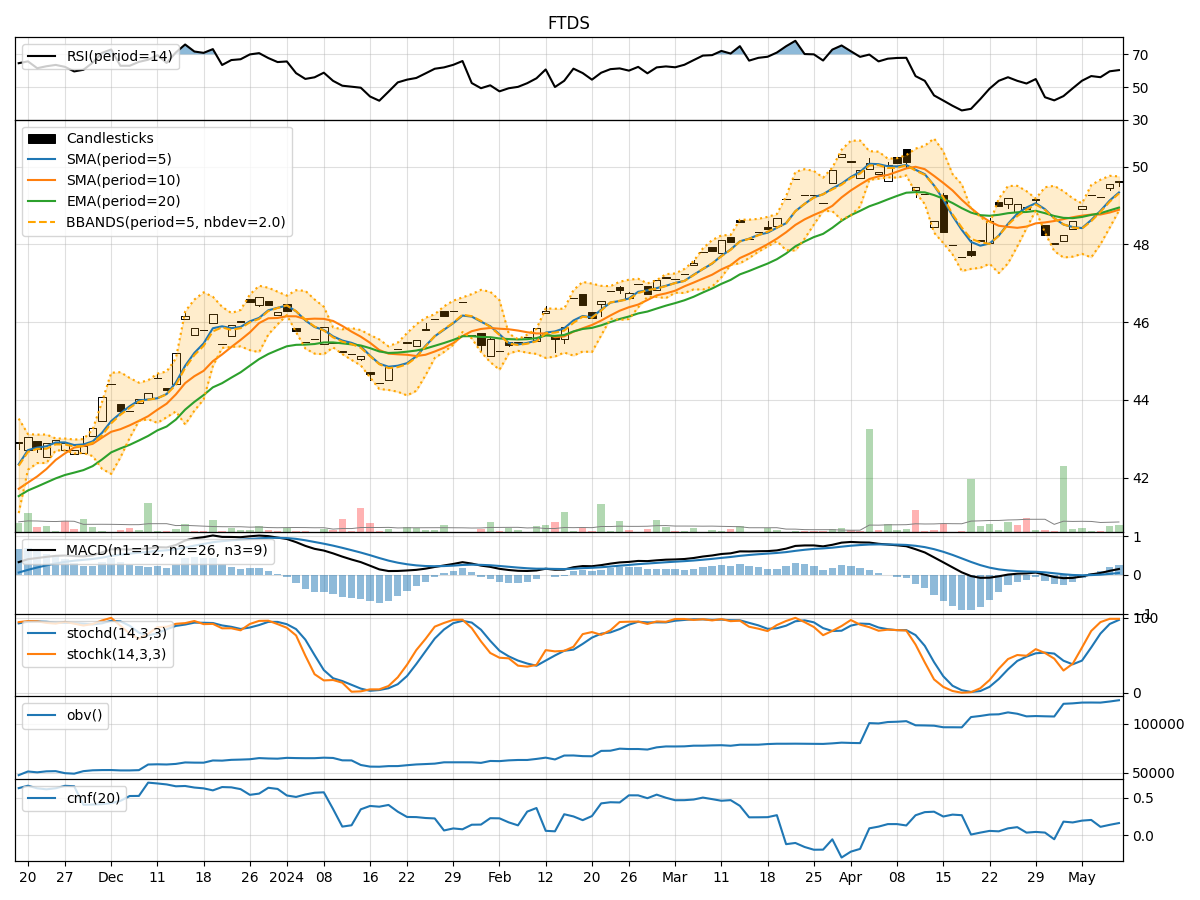
- Moving Averages (MA): The 5-day Moving Average (MA) has been consistently rising, indicating an upward trend in the stock price.
- MACD: The Moving Average Convergence Divergence (MACD) has shown positive values, suggesting bullish momentum.
- EMA: The Exponential Moving Average (EMA) has been trending upwards, supporting the bullish sentiment in the short term.
Key Observation: The trend indicators point towards a bullish outlook for FTDS stock.
Momentum Analysis:
- RSI: The Relative Strength Index (RSI) has been increasing, indicating strengthening momentum.
- Stochastic Oscillator: Both %K and %D values have been high, suggesting strong buying pressure.
- Williams %R: The Williams %R is in the oversold territory, indicating a potential reversal.
Key Observation: Momentum indicators signal a bullish momentum for FTDS stock.
Volatility Analysis:
- Bollinger Bands (BB): The Bollinger Bands have been widening, indicating increased volatility.
- Bollinger %B: The %B value has been fluctuating within the bands, reflecting volatility in the stock price.
Key Observation: Volatility indicators suggest increased volatility in the near term.
Volume Analysis:
- On-Balance Volume (OBV): The OBV has been steadily increasing, indicating strong buying volume.
- Chaikin Money Flow (CMF): The CMF has been positive, suggesting money flow into the stock.
Key Observation: Volume indicators point towards positive buying volume for FTDS stock.
Conclusion:
Based on the analysis of trend, momentum, volatility, and volume indicators, the overall outlook for FTDS stock is bullish. The trend is upward, momentum is strong, volatility is increasing, and buying volume is robust. Therefore, the next few days are likely to see further upward movement in the stock price. Investors may consider buying or holding positions in FTDS stock for potential gains.
Disclaimer:
Remember that market conditions can change rapidly, and it is essential to monitor the indicators regularly for any shifts in trend or momentum. Additionally, consider other fundamental factors and risk management strategies before making investment decisions.