Technical Analysis of FTGC 2024-05-10
Overview:
In analyzing the technical indicators for FTGC over the last 5 days, we will delve into the trend, momentum, volatility, and volume indicators to provide a comprehensive outlook on the possible stock price movement in the coming days. By examining these key indicators, we aim to offer valuable insights and predictions to guide investment decisions.
Trend Analysis:
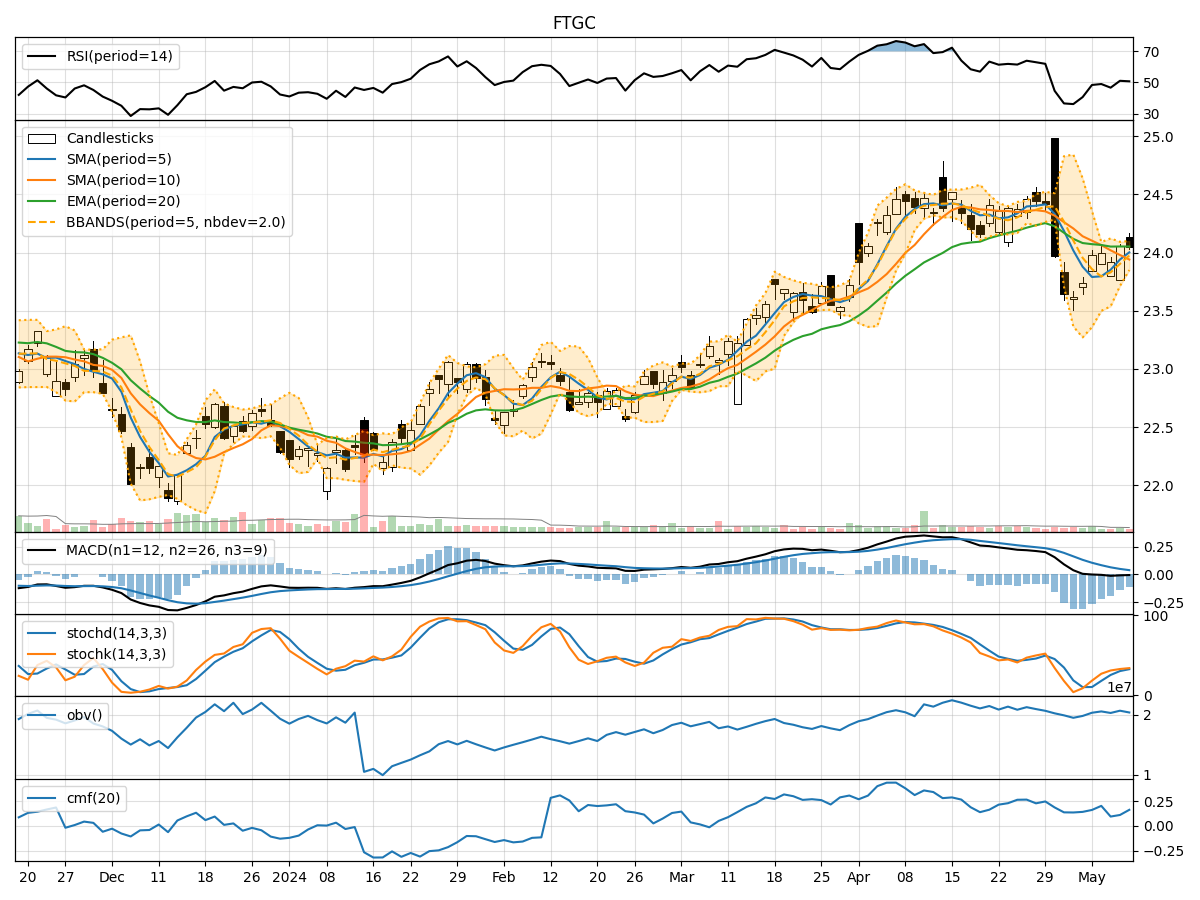
- Moving Averages (MA): The 5-day MA has been fluctuating around the closing prices, indicating short-term price trends. The SMA(10) and EMA(20) have shown a slight downward trend, suggesting a potential bearish sentiment.
- MACD: The MACD and Signal line have been consistently negative, indicating a bearish trend in the stock price movement.
- Conclusion: The trend indicators suggest a bearish outlook for the stock in the near term.
Momentum Analysis:
- RSI: The RSI has been hovering around the mid-level, indicating a neutral momentum in the stock.
- Stochastic Oscillator: Both %K and %D have been moving upwards but are still in the neutral zone, suggesting a potential shift towards bullish momentum.
- Conclusion: The momentum indicators show a neutral to slightly bullish sentiment for the stock.
Volatility Analysis:
- Bollinger Bands (BB): The stock price has been trading within the bands, with the bands narrowing, indicating decreasing volatility.
- Conclusion: Volatility indicators suggest a consolidation phase in the stock price movement.
Volume Analysis:
- On-Balance Volume (OBV): The OBV has shown mixed movements, indicating indecision among investors.
- Chaikin Money Flow (CMF): The CMF has been positive but relatively low, suggesting some buying pressure.
- Conclusion: Volume indicators reflect mixed sentiments among investors.
Overall Conclusion:
- Based on the analysis of trend, momentum, volatility, and volume indicators, the next few days' possible stock price movement for FTGC is likely to be:
- Trend: Bearish
- Momentum: Neutral to slightly bullish
- Volatility: Consolidation
- Volume: Mixed sentiments
- Key Opinion: The stock is likely to experience a bearish trend in the near term, with potential for neutral to slightly bullish momentum and consolidation in volatility. Investors should closely monitor key support and resistance levels for potential entry or exit points.
By considering these technical indicators collectively, investors can make more informed decisions regarding their FTGC investments. It is crucial to stay updated on market developments and adjust strategies accordingly to navigate the dynamic stock market landscape effectively.