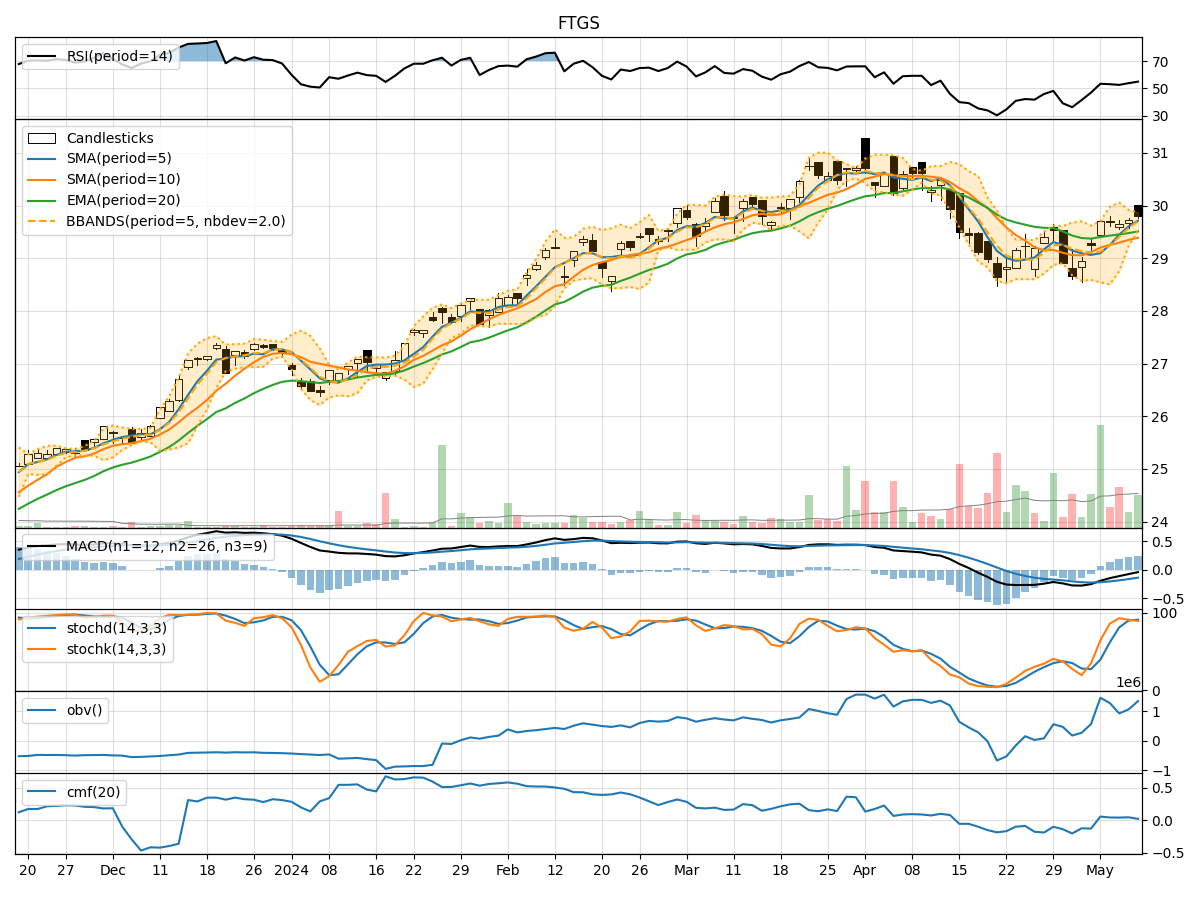
Technical Analysis of FTGS 2024-05-10
Overview:
In analyzing the technical indicators for FTGS over the last 5 days, we will delve into the trend, momentum, volatility, and volume indicators to provide a comprehensive outlook on the possible stock price movement in the coming days.
Trend Analysis:
- Moving Averages (MA): The 5-day Moving Average (MA) has been consistently above the Simple Moving Average (SMA) and Exponential Moving Average (EMA), indicating a short-term bullish trend.
- MACD: The MACD line has been negative but showing signs of convergence towards the signal line, suggesting a potential bullish crossover.
- MACD Histogram: The MACD Histogram has been consistently increasing, indicating strengthening bullish momentum.
Momentum Analysis:
- RSI: The Relative Strength Index (RSI) has been fluctuating around the neutral zone, indicating indecision in the market.
- Stochastic Oscillator: Both %K and %D have been in overbought territory, suggesting a potential reversal or consolidation.
- Williams %R: The Williams %R is in oversold territory, indicating a possible buying opportunity.
Volatility Analysis:
- Bollinger Bands (BB): The stock price has been trading within the Bollinger Bands, with the bands narrowing, suggesting a period of low volatility.
- Bollinger %B: The %B indicator is hovering around 1, indicating that the stock price is at the upper band, potentially signaling overbought conditions.
Volume Analysis:
- On-Balance Volume (OBV): The OBV has been fluctuating, indicating mixed buying and selling pressure.
- Chaikin Money Flow (CMF): The CMF has been positive but decreasing, suggesting a potential decrease in buying pressure.
Key Observations:
- The trend indicators suggest a potential bullish crossover in the short term.
- Momentum indicators show mixed signals with a possibility of a reversal or consolidation.
- Volatility indicators point towards a period of low volatility and potential overbought conditions.
- Volume indicators indicate mixed buying and selling pressure with a decrease in buying momentum.
Conclusion:
Based on the analysis of the technical indicators, the stock price of FTGS is likely to experience sideways consolidation in the coming days. Traders should exercise caution and closely monitor key levels such as the moving averages and Bollinger Bands for potential breakout or reversal signals. The market is currently in a state of indecision, and it is advisable to wait for clearer signals before taking significant trading positions.