Technical Analysis of FTHF 2024-05-10
Overview:
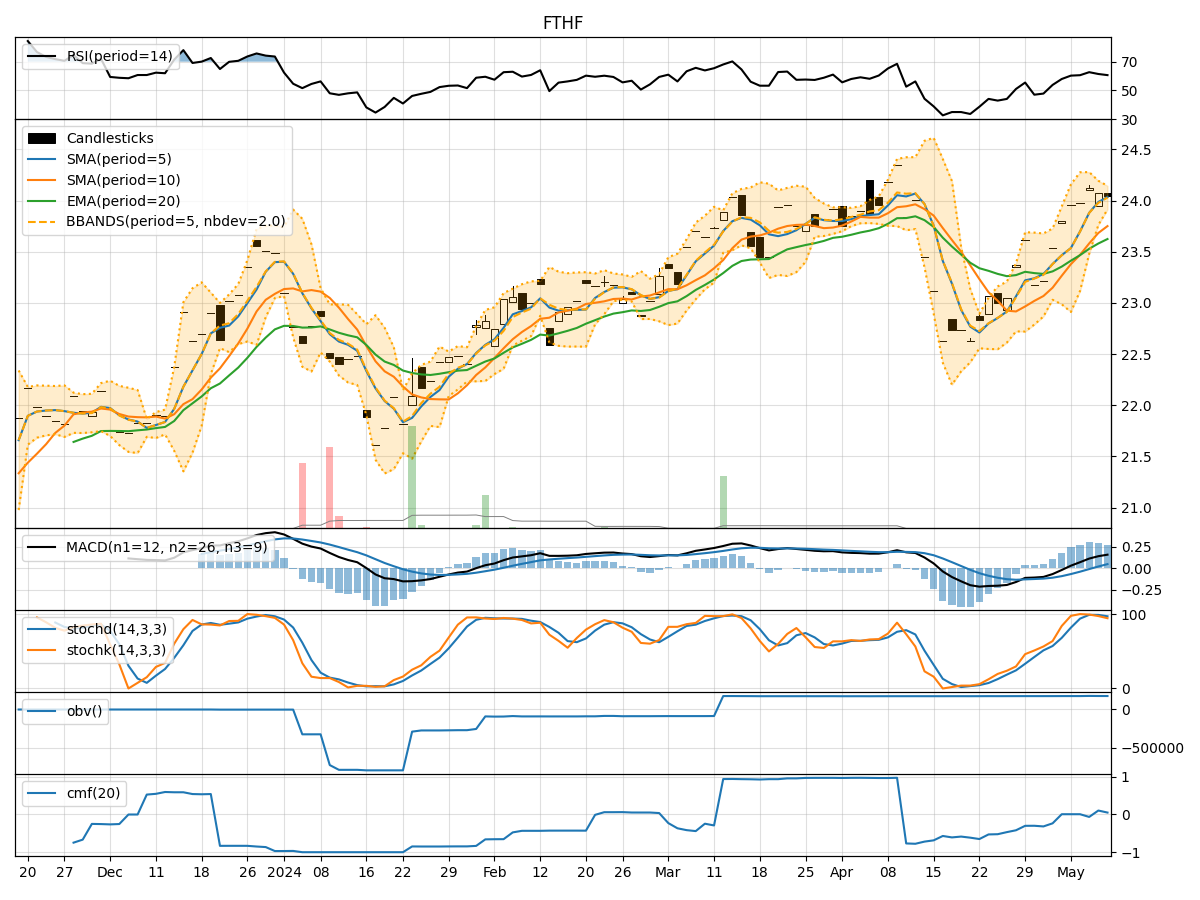
In analyzing the technical indicators for FTHF over the last 5 days, we will delve into the trend, momentum, volatility, and volume indicators to provide a comprehensive outlook on the possible stock price movement in the coming days.
Trend Analysis:
- Moving Averages (MA): The 5-day Moving Average (MA) has been consistently above the Simple Moving Average (SMA) and Exponential Moving Average (EMA), indicating a bullish trend.
- MACD: The MACD line has been consistently above the signal line, with the MACD Histogram showing an increasing positive trend, further supporting a bullish sentiment.
Momentum Analysis:
- RSI: The Relative Strength Index (RSI) has been hovering around the 60-62 range, indicating a neutral to slightly bullish momentum.
- Stochastic Oscillator: Both %K and %D have been gradually decreasing, suggesting a potential shift towards a bearish momentum.
Volatility Analysis:
- Bollinger Bands (BB): The stock price has been trading within the Bollinger Bands, with the bands narrowing over the last few days, indicating decreasing volatility.
- Bollinger %B: The %B indicator has been decreasing, signaling a potential consolidation phase.
Volume Analysis:
- On-Balance Volume (OBV): The OBV has shown a slight increase over the last few days, indicating a positive accumulation of volume.
- Chaikin Money Flow (CMF): The CMF has been fluctuating around zero, suggesting a balance between buying and selling pressure.
Conclusion:
Based on the analysis of the technical indicators, the stock of FTHF is likely to experience sideways movement in the coming days. The trend indicators suggest a bullish bias, supported by the moving averages and MACD. However, the momentum indicators show a potential shift towards bearish momentum, as indicated by the Stochastic Oscillator.
The volatility indicators point towards a consolidation phase, with decreasing volatility and a narrowing Bollinger Bands. The volume indicators reflect a balanced accumulation of volume, with the OBV showing a slight increase.
In conclusion, while the trend remains bullish, investors should be cautious of the potential shift in momentum towards bearish territory. The stock is likely to trade sideways in the near term, with a possibility of a slight downward correction. It is advisable to closely monitor the momentum indicators for any significant changes in market sentiment.