Technical Analysis of FTHI 2024-05-10
Overview:
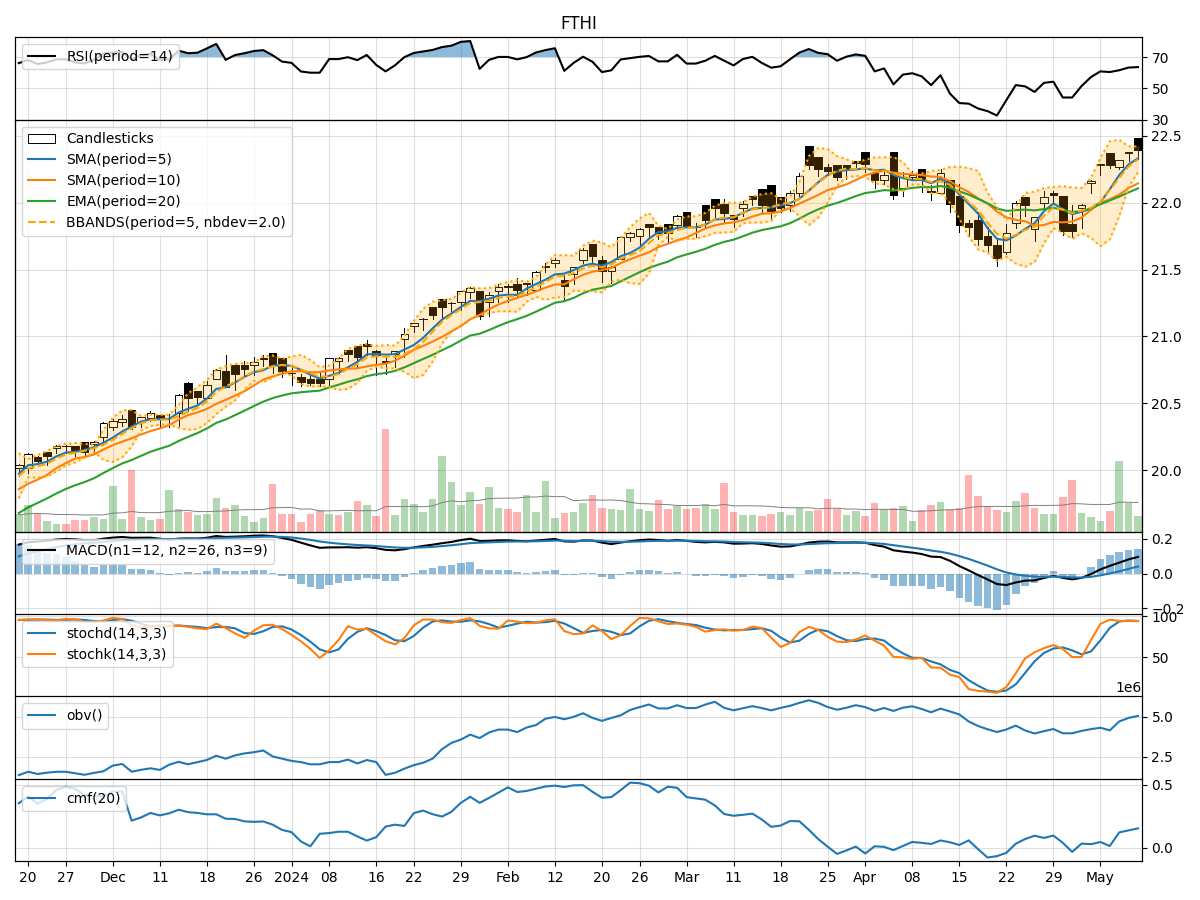
In the last 5 trading days, FTHI stock has shown a consistent uptrend based on the moving averages, with the MACD indicating a positive momentum. The RSI and Stochastic indicators suggest the stock is not overbought yet, and the Bollinger Bands show a narrowing volatility. The OBV and CMF indicators also point towards positive volume flow.
Trend Analysis:
- Moving Averages (MA): The stock price has been consistently above the 5-day moving average, indicating a bullish trend.
- MACD: The MACD line has been above the signal line, showing positive momentum.
Key Observation: The stock is in an upward trend based on the moving averages and MACD.
Momentum Analysis:
- RSI: The RSI is in the neutral zone, not indicating overbought or oversold conditions.
- Stochastic Oscillator: Both %K and %D are in the overbought zone but not showing any signs of reversal.
Key Observation: Momentum indicators suggest the stock is not overbought yet.
Volatility Analysis:
- Bollinger Bands (BB): The Bollinger Bands are narrowing, indicating decreasing volatility.
Key Observation: Volatility is decreasing, which could lead to a potential breakout.
Volume Analysis:
- On-Balance Volume (OBV): The OBV has been steadily increasing, showing positive volume flow.
- Chaikin Money Flow (CMF): The CMF is positive, indicating buying pressure.
Key Observation: Volume indicators suggest positive accumulation in the stock.
Conclusion:
Based on the technical analysis of FTHI stock: - The trend is bullish with the stock consistently trading above the moving averages. - Momentum indicators suggest the stock is not overbought yet, leaving room for further upside. - Volatility is decreasing, which could lead to a potential breakout. - Volume indicators show positive accumulation in the stock.
Forecast:
Considering the overall technical indicators and the current market dynamics, the next few days for FTHI stock are likely to see a continuation of the bullish trend with the potential for a breakout due to decreasing volatility. Traders and investors could consider buying on dips to capitalize on the upward momentum. However, it is essential to monitor the price action closely for any signs of reversal or increased selling pressure.