Technical Analysis of FTIF 2024-05-10
Overview:
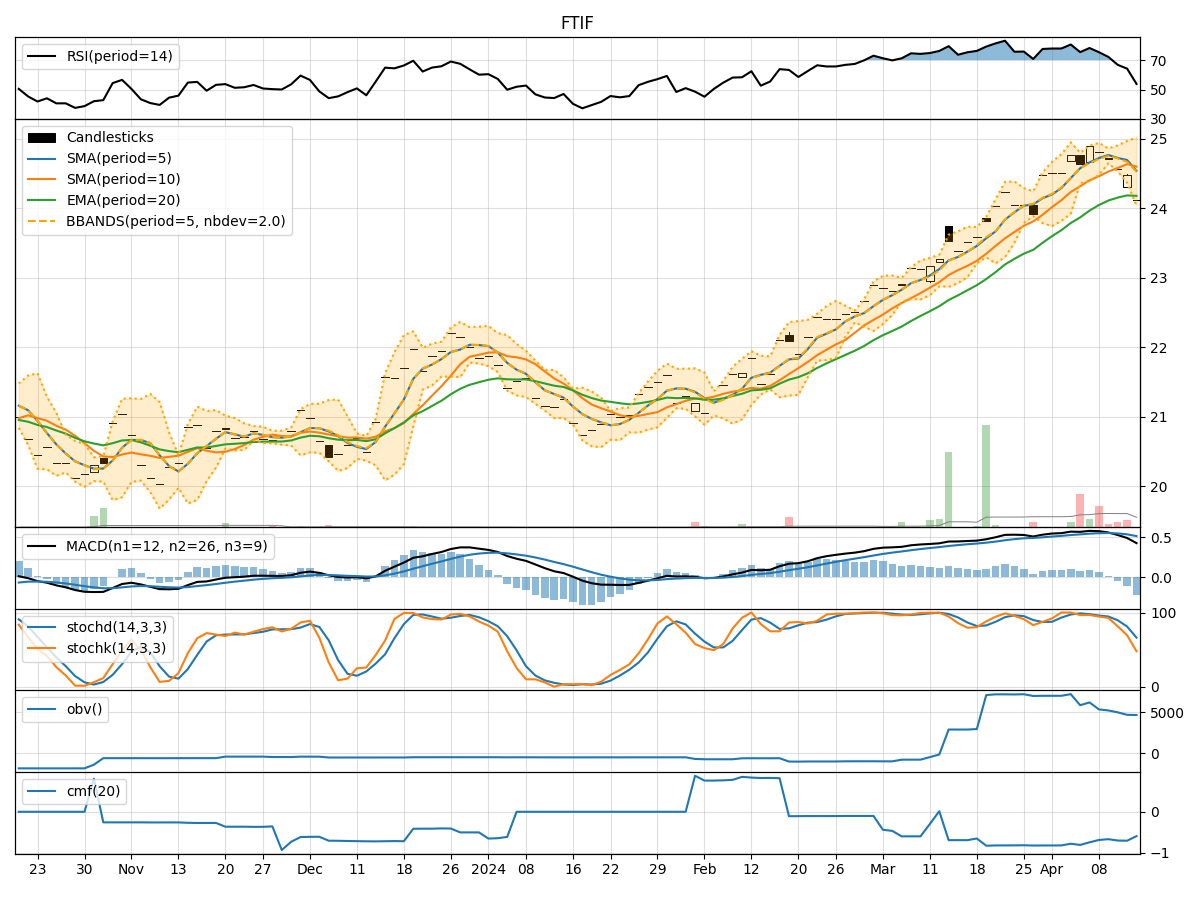
In analyzing the technical indicators for FTIF over the last 5 days, we will delve into the trends, momentum, volatility, and volume aspects to provide a comprehensive outlook on the possible stock price movement. By examining key indicators such as moving averages, MACD, RSI, Bollinger Bands, and OBV, we aim to offer valuable insights and predictions for the upcoming days.
Trend Analysis:
- Moving Averages (MA): The 5-day MA has been fluctuating around the closing prices, indicating a lack of strong trend direction.
- MACD: The MACD line has been consistently below the signal line, suggesting a bearish momentum in the short term.
- EMA: The EMA has been relatively stable, reflecting a neutral trend.
Key Observation: The trend indicators show a mixed signal with a slight bearish bias.
Momentum Analysis:
- RSI: The RSI values have been hovering around the mid-range, indicating a lack of strong momentum either bullish or bearish.
- Stochastic Oscillator: The Stochastics have shown some upward movement but are not in overbought territory yet.
- Williams %R: The Williams %R values have been fluctuating, not providing a clear direction.
Key Observation: Momentum indicators suggest a neutral stance with no clear bullish or bearish momentum.
Volatility Analysis:
- Bollinger Bands: The Bollinger Bands have been relatively narrow, indicating low volatility in the stock price.
Key Observation: Volatility indicators suggest a period of consolidation or sideways movement.
Volume Analysis:
- On-Balance Volume (OBV): The OBV has shown some increase, indicating a potential accumulation of the stock.
- Chaikin Money Flow (CMF): The CMF has been positive, suggesting buying pressure in the stock.
Key Observation: Volume indicators point towards a potential bullish sentiment with increasing buying interest.
Conclusion:
Based on the analysis of the technical indicators, the next few days for FTIF could see sideways movement with a slight bullish bias. The trend indicators show a mixed signal, while momentum indicators suggest a neutral stance. Volatility indicators point towards consolidation, and volume indicators indicate a potential bullish sentiment.
Recommendation: Consider monitoring the stock closely for any breakout above key resistance levels or a sustained increase in buying volume to confirm a bullish trend. It is advisable to set stop-loss levels to manage risk in case of unexpected price movements.
Always remember to conduct further research and consider fundamental factors before making any investment decisions.