Technical Analysis of FTLS 2024-05-10
Overview:
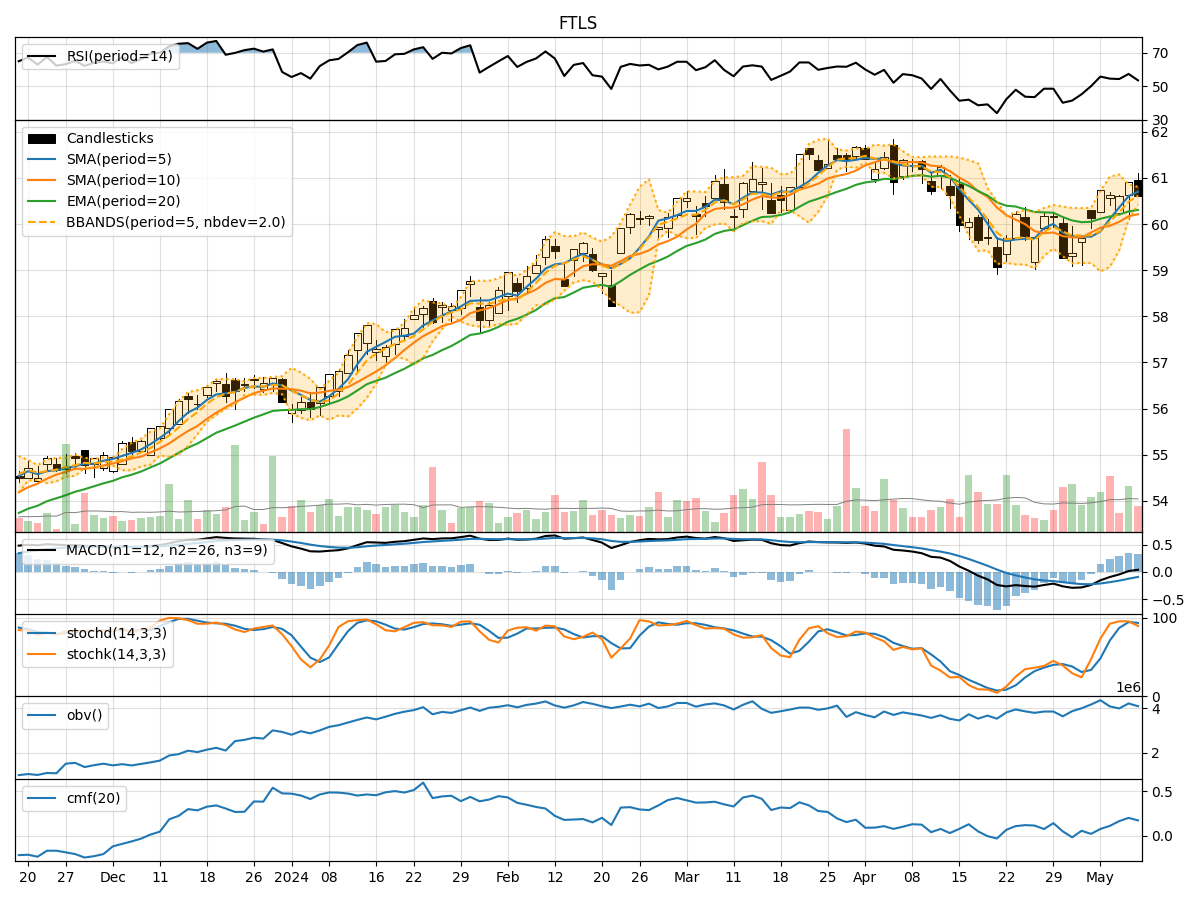
In the last 5 trading days, FTLS stock has shown mixed signals across various technical indicators. The trend indicators suggest a slight bullish sentiment, with the moving averages trending upwards. Momentum indicators show a mixed picture, with RSI fluctuating and stochastic oscillators indicating overbought conditions. Volatility indicators suggest decreasing volatility, while volume indicators show mixed signals.
Trend Indicators:
- Moving Averages (MA): The 5-day MA is trending above the 10-day SMA and 20-day EMA, indicating a short-term bullish trend.
- MACD: The MACD line is positive, indicating bullish momentum, but the MACD histogram is decreasing, suggesting a potential slowdown in momentum.
Momentum Indicators:
- RSI: The RSI has been fluctuating around the 50 level, indicating indecision in the market.
- Stochastic Oscillators: The stochastic indicators have been in overbought territory, suggesting a possible reversal or consolidation.
Volatility Indicators:
- Bollinger Bands (BB): The bands are narrowing, indicating decreasing volatility and a potential upcoming breakout.
- Bollinger %B (BBP): The %B is below 1, suggesting the stock is trading below the lower band, potentially indicating an oversold condition.
Volume Indicators:
- On-Balance Volume (OBV): The OBV has been fluctuating, indicating mixed buying and selling pressure.
- Chaikin Money Flow (CMF): The CMF is positive, suggesting buying pressure, but the value has been decreasing, indicating a potential weakening of buying momentum.
Key Observations:
- The trend indicators suggest a short-term bullish sentiment, supported by moving averages.
- Momentum indicators show mixed signals, with RSI indicating indecision and stochastic oscillators in overbought territory.
- Volatility indicators point towards decreasing volatility, potentially leading to a breakout.
- Volume indicators show mixed signals, with OBV fluctuating and CMF indicating a weakening of buying pressure.
Conclusion:
Based on the analysis of the technical indicators, the next few days' possible stock price movement for FTLS is likely to be sideways with a slight bullish bias. The trend indicators support a bullish sentiment, but the mixed signals from momentum, volatility, and volume indicators suggest a period of consolidation or indecision in the market. Traders should closely monitor key levels and wait for confirmation of a clear trend before making significant trading decisions.