Technical Analysis of FTSD 2024-05-10
Overview:
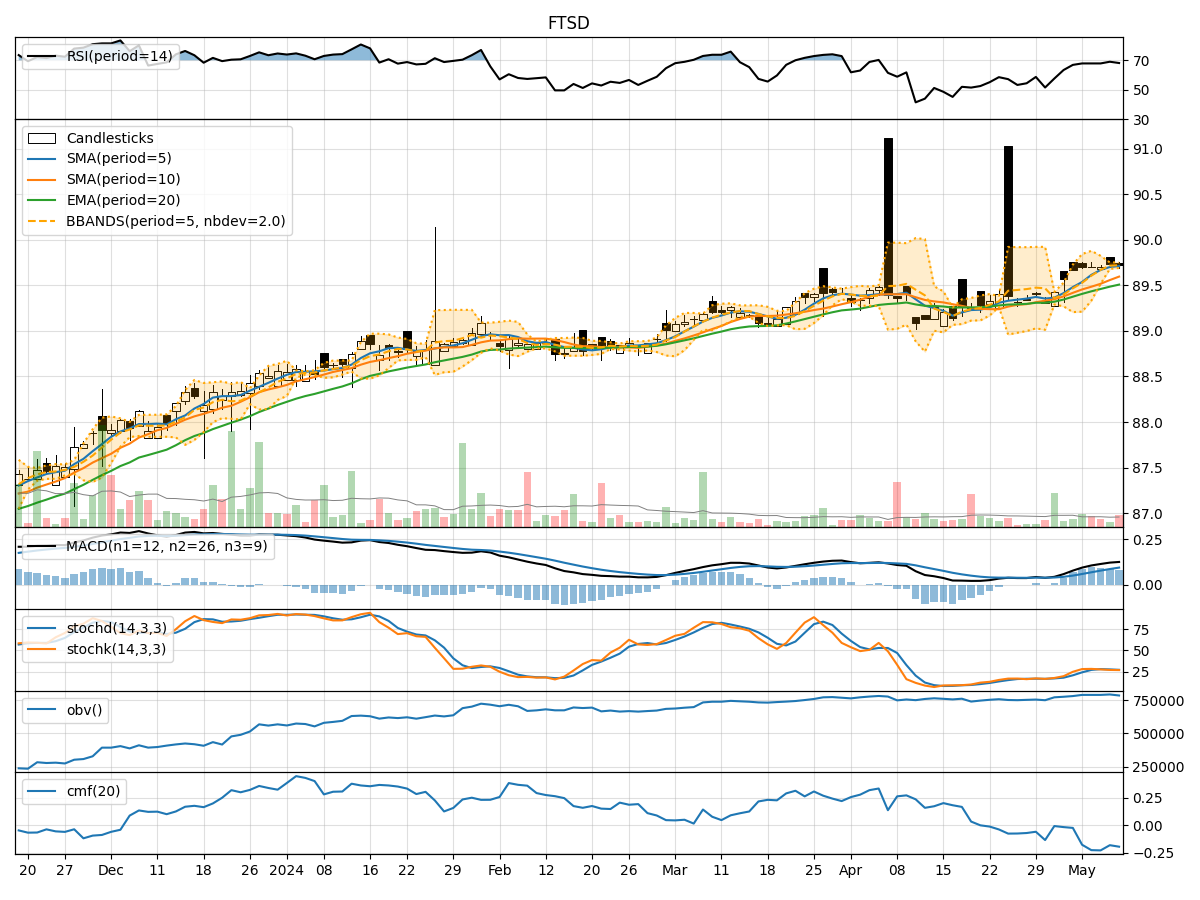
In analyzing the technical indicators for FTSD over the last 5 days, we will delve into the trend, momentum, volatility, and volume indicators to provide a comprehensive outlook on the possible stock price movement in the coming days.
Trend Indicators:
- Moving Averages (MA): The 5-day Moving Average has been consistently above the Simple Moving Average (SMA) and Exponential Moving Average (EMA), indicating a bullish trend.
- MACD: The MACD line has been above the signal line, with both lines showing an upward trend, suggesting bullish momentum.
- MACD Histogram: The MACD Histogram has been increasing, indicating strengthening bullish momentum.
Momentum Indicators:
- RSI: The Relative Strength Index (RSI) has been in the overbought territory, suggesting a potential pullback in the stock price.
- Stochastic Oscillator: Both %K and %D lines have been in the oversold zone, indicating a potential reversal in the stock price.
- Williams %R: The Williams %R has been in the oversold region, signaling a possible buying opportunity.
Volatility Indicators:
- Bollinger Bands: The stock price has been trading within the Bollinger Bands, with the bands narrowing, indicating reduced volatility.
- Bollinger %B: The %B indicator has been fluctuating around the midline, suggesting a period of consolidation.
Volume Indicators:
- On-Balance Volume (OBV): The OBV has been relatively stable, indicating a balance between buying and selling pressure.
- Chaikin Money Flow (CMF): The CMF has been negative, suggesting a lack of buying interest in the stock.
Key Observations:
- The trend indicators point towards a bullish sentiment in the stock, supported by the moving averages and MACD analysis.
- Momentum indicators, such as RSI and Stochastic Oscillator, suggest a potential pullback or reversal in the stock price due to overbought conditions.
- Volatility indicators indicate a period of reduced volatility and consolidation in the stock price.
- Volume indicators show a lack of significant buying interest, as reflected in the negative CMF.
Conclusion:
Based on the analysis of the technical indicators, the next few days' possible stock price movement for FTSD is likely to experience a short-term pullback or consolidation before potentially resuming its bullish trend. Traders should exercise caution and consider waiting for a clearer signal before entering new positions.