Technical Analysis of FTXG 2024-05-10
Overview:
In analyzing the technical indicators for FTXG over the last 5 days, we will delve into the trend, momentum, volatility, and volume indicators to provide a comprehensive outlook on the possible stock price movement in the coming days.
Trend Indicators:
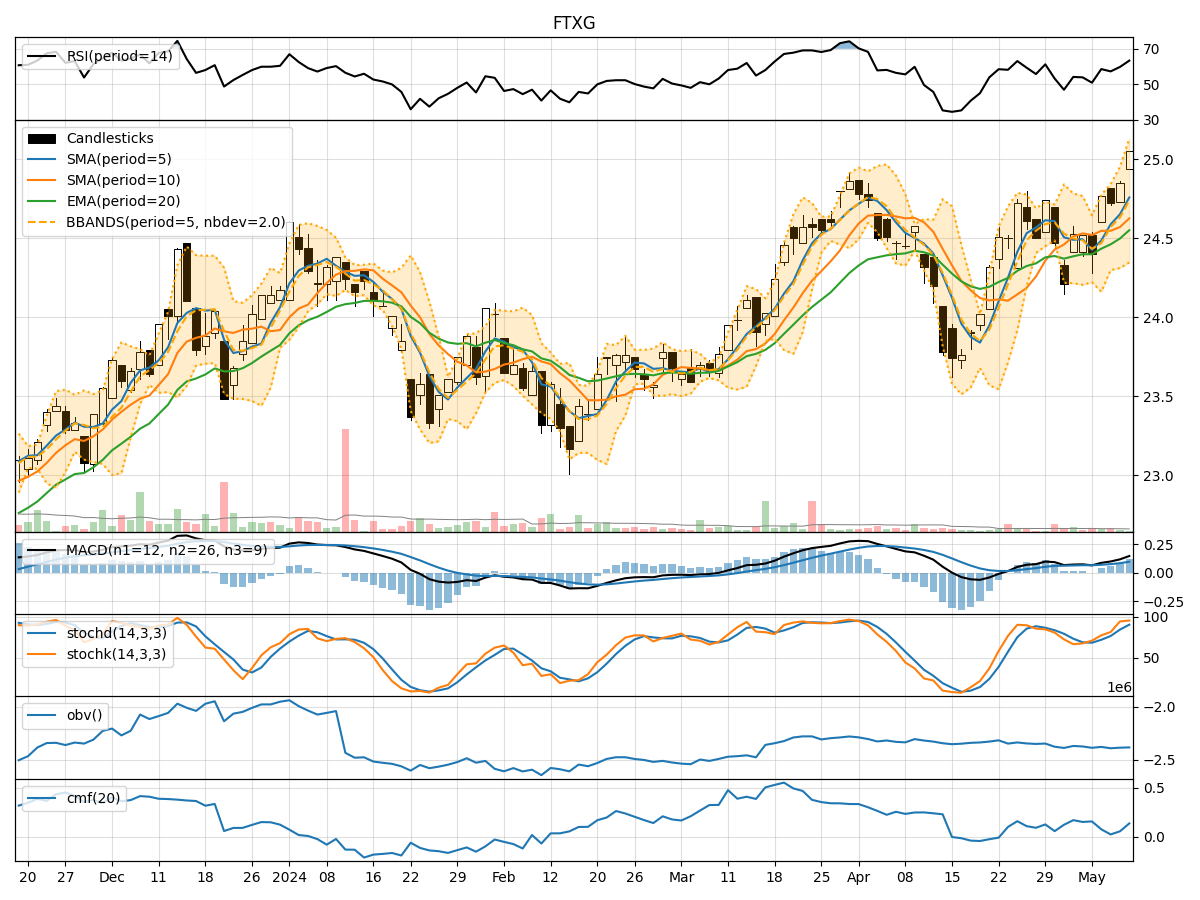
- Moving Averages (MA): The 5-day MA has been trending slightly above the Simple Moving Average (SMA) and Exponential Moving Average (EMA), indicating a short-term bullish trend.
- MACD: The MACD line has been consistently above the signal line, with both lines showing an upward trend, suggesting bullish momentum.
- MACD Histogram: The MACD Histogram has been increasing over the past 5 days, indicating strengthening bullish momentum.
Momentum Indicators:
- RSI: The Relative Strength Index (RSI) has been gradually increasing and is currently in the neutral zone, suggesting potential for further upside movement.
- Stochastic Oscillator: Both %K and %D lines of the Stochastic Oscillator are in the overbought zone, indicating a strong bullish momentum.
- Williams %R: The Williams %R is close to the oversold territory, signaling a potential reversal to the upside.
Volatility Indicators:
- Bollinger Bands: The stock price has been trading within the upper Bollinger Band, indicating an overbought condition. However, the bands are widening, suggesting increasing volatility.
- Bollinger %B: The %B indicator is above 0.8, indicating a potential overbought situation.
- Average True Range (ATR): The ATR has been increasing, reflecting rising volatility in the stock.
Volume Indicators:
- On-Balance Volume (OBV): The OBV has been fluctuating but generally trending upwards, indicating accumulation by investors.
- Chaikin Money Flow (CMF): The CMF has been positive over the past 5 days, suggesting buying pressure in the stock.
Key Observations and Opinions:
- Trend: The trend indicators suggest a bullish sentiment in the short term.
- Momentum: Momentum indicators indicate a strong bullish momentum, but some indicators are approaching overbought levels.
- Volatility: Volatility is increasing, which could lead to larger price swings in the coming days.
- Volume: Accumulation is evident from the OBV and CMF, supporting the bullish bias.
Conclusion:
Based on the analysis of the technical indicators, the next few days' possible stock price movement for FTXG is likely to continue upwards in the short term. The bullish trend, strong momentum, increasing volatility, and positive volume accumulation all point towards a potential upward movement in the stock price. However, traders should be cautious of potential overbought conditions in some momentum indicators and monitor the volatility for any sudden price fluctuations.