Technical Analysis of FTXH 2024-05-10
Overview:
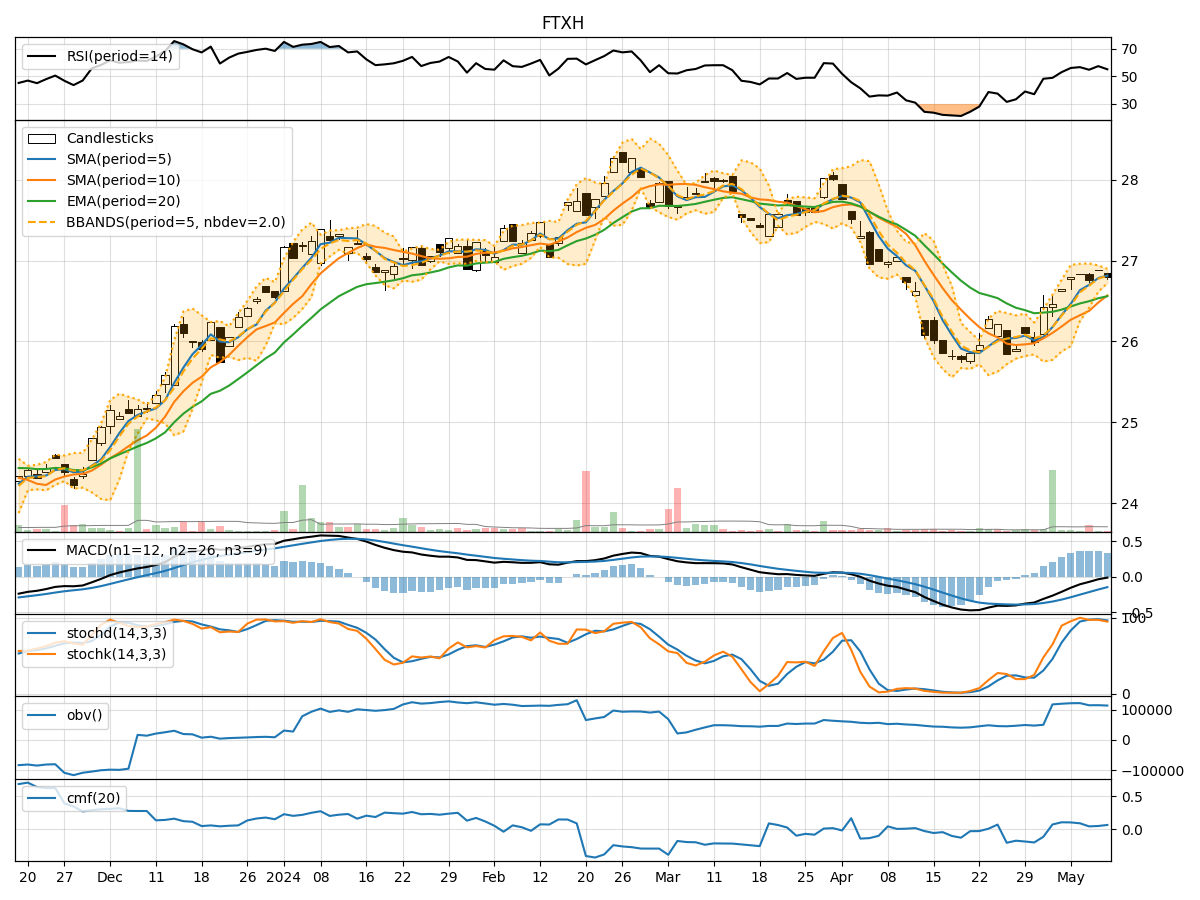
In analyzing the technical indicators for FTXH over the last 5 days, we will delve into the trend, momentum, volatility, and volume indicators to provide a comprehensive outlook on the possible stock price movement in the coming days. By examining these key factors, we aim to offer valuable insights and predictions to guide your investment decisions.
Trend Indicators:
- Moving Averages (MA): The 5-day MA has been consistently above the closing prices, indicating a short-term uptrend.
- MACD: The MACD line has been negative but converging towards the signal line, suggesting a potential reversal in the downtrend.
- EMA: The EMA has been slightly increasing, reflecting a gradual uptrend.
Key Observation: The trend indicators show a mixed signal with a slight bullish bias.
Momentum Indicators:
- RSI: The RSI has been fluctuating around the neutral level of 50, indicating a lack of strong momentum.
- Stochastic Oscillator: Both %K and %D have been in overbought territory, signaling a potential reversal or consolidation.
- Williams %R: The indicator has been hovering in the oversold region, suggesting a possible reversal to the upside.
Key Observation: Momentum indicators suggest a neutral to slightly bearish sentiment.
Volatility Indicators:
- Bollinger Bands: The bands have been narrowing, indicating decreasing volatility and a potential breakout.
- Bollinger %B: The %B is below 1, suggesting the stock is trading below the upper band.
Key Observation: Volatility indicators point towards a potential breakout or a period of consolidation.
Volume Indicators:
- On-Balance Volume (OBV): The OBV has been fluctuating, indicating indecision among market participants.
- Chaikin Money Flow (CMF): The CMF has been positive but relatively low, signaling some buying pressure.
Key Observation: Volume indicators reflect a lack of strong conviction from market participants.
Conclusion:
Based on the analysis of the technical indicators, the next few days for FTXH could see sideways movement with a slight bullish bias. The trend indicators suggest a potential uptrend, while momentum indicators indicate a neutral to slightly bearish sentiment. Volatility indicators point towards a potential breakout or consolidation, and volume indicators show indecision among market participants.
Overall, a cautious approach with a focus on key support and resistance levels is recommended for trading or investing in FTXH in the coming days.