Technical Analysis of FTXR 2024-05-10
Overview:
In analyzing the technical indicators for FTXR over the last 5 days, we will delve into the trend, momentum, volatility, and volume indicators to provide a comprehensive outlook on the possible stock price movement in the coming days. By examining these key aspects, we aim to offer valuable insights and predictions for potential investors.
Trend Indicators:
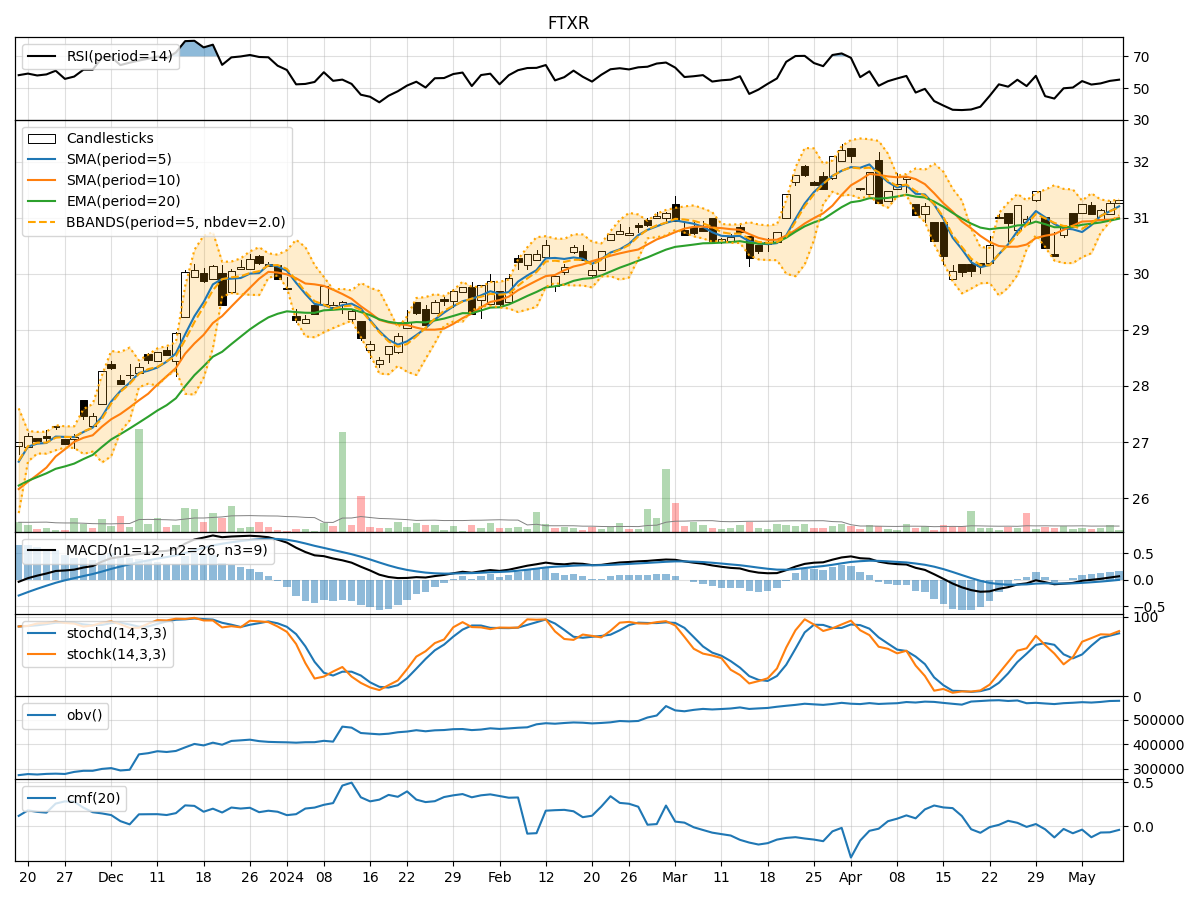
- Moving Averages (MA): The 5-day Moving Average has been consistently above the Simple Moving Average (SMA) and Exponential Moving Average (EMA), indicating a bullish trend.
- MACD: The MACD line has been consistently above the signal line, with both lines showing an upward trend, suggesting bullish momentum.
- MACD Histogram: The MACD Histogram has been increasing over the past 5 days, indicating strengthening bullish momentum.
Momentum Indicators:
- RSI: The Relative Strength Index (RSI) has been gradually increasing and is currently in the neutral zone, indicating potential for further upside movement.
- Stochastic Oscillator: Both %K and %D lines of the Stochastic Oscillator are in the overbought zone, suggesting a potential reversal or consolidation.
- Williams %R: The Williams %R is in the oversold territory, indicating a potential buying opportunity.
Volatility Indicators:
- Bollinger Bands: The stock price has been trading within the Bollinger Bands, with the bands narrowing, suggesting a period of consolidation.
- Bollinger %B: The %B indicator is above 0.5, indicating a bullish trend.
- Bollinger Band Width: The Band Width has been decreasing, signaling a decrease in volatility.
Volume Indicators:
- On-Balance Volume (OBV): The OBV has been steadily increasing, indicating accumulation by investors.
- Chaikin Money Flow (CMF): The CMF has been negative but improving, suggesting a potential shift towards buying pressure.
Conclusion:
Based on the analysis of the technical indicators, the stock of FTXR is showing bullish signals in terms of trend and momentum. However, the overbought conditions in the Stochastic Oscillator and the narrowing Bollinger Bands indicate a possible consolidation or sideways movement in the short term. The increasing OBV and improving CMF suggest underlying buying pressure.
Therefore, the next few days for FTXR are likely to see a sideways movement with a bullish bias. Investors should monitor the price action closely for potential entry or exit points, considering the possibility of a consolidation phase before any significant upward movement.