Technical Analysis of FUNL 2024-05-10
Overview:
In analyzing the technical indicators for FUNL over the last 5 days, we will delve into the trend, momentum, volatility, and volume indicators to provide a comprehensive outlook on the possible stock price movement in the coming days.
Trend Analysis:
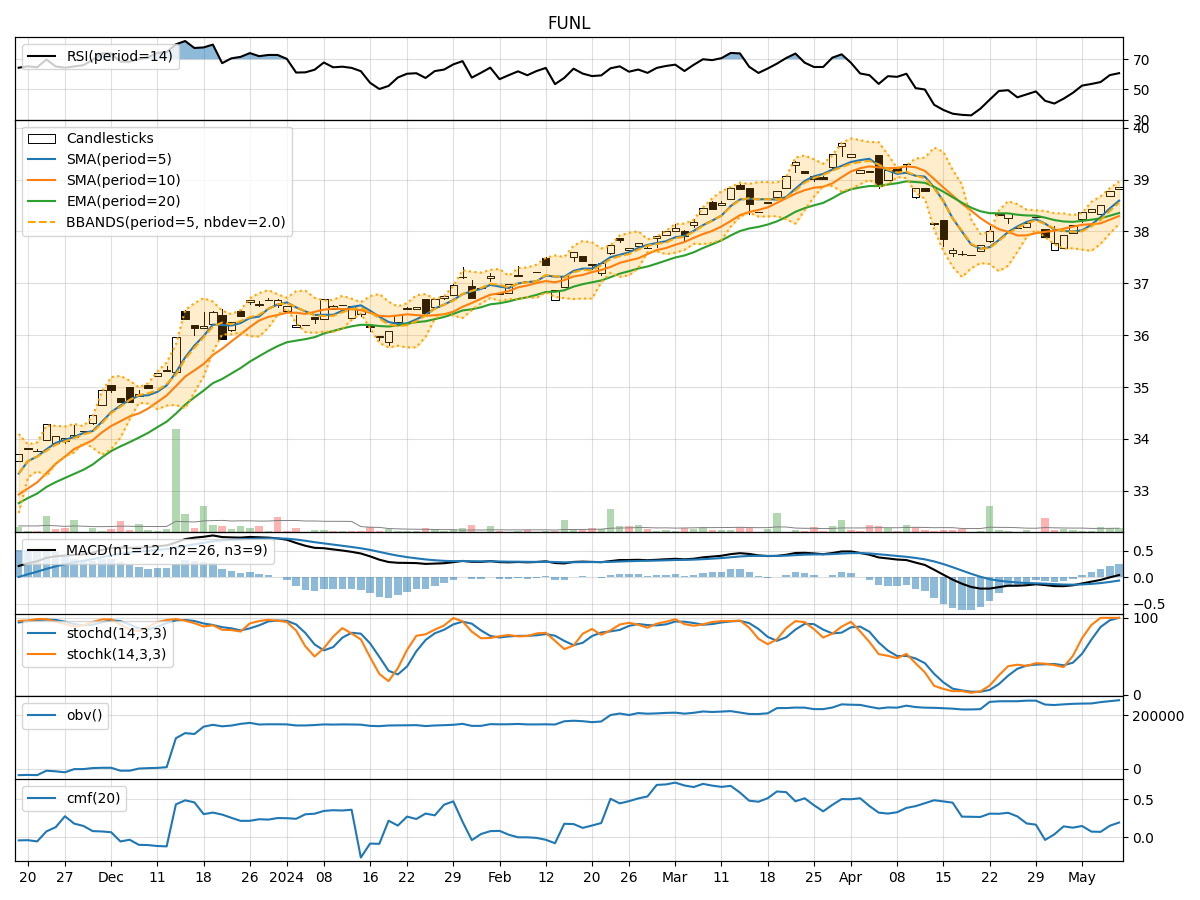
- Moving Averages (MA): The 5-day Moving Average has been consistently above the Simple Moving Average (SMA) and Exponential Moving Average (EMA), indicating a bullish trend.
- MACD: The MACD line has been consistently above the signal line, with the MACD Histogram showing an increasing positive value, suggesting a strengthening bullish momentum.
Momentum Analysis:
- RSI: The Relative Strength Index (RSI) has been gradually increasing and is currently in the neutral zone, indicating potential room for further upside.
- Stochastic Oscillator: Both %K and %D have been at 100%, signaling overbought conditions but also strong bullish momentum.
Volatility Analysis:
- Bollinger Bands (BB): The stock price has been consistently trading above the middle Bollinger Band (BBM), indicating an upward trend with moderate volatility.
- Bollinger Band Width (BBW): The BBW has been relatively stable, suggesting a consistent level of volatility in the stock.
Volume Analysis:
- On-Balance Volume (OBV): The OBV has been steadily increasing, indicating accumulation by investors.
- Chaikin Money Flow (CMF): The CMF has been positive and rising, reflecting buying pressure in the stock.
Key Observations:
- The trend indicators suggest a strong bullish sentiment with moving averages and MACD supporting an upward trajectory.
- Momentum indicators show overbought conditions but also strong buying momentum.
- Volatility remains moderate, indicating a stable uptrend with consistent price movements.
- Volume indicators point towards increasing accumulation and buying pressure in the stock.
Conclusion:
Based on the analysis of the technical indicators, the stock is likely to continue its upward movement in the coming days. The bullish trend supported by moving averages, MACD, RSI, and OBV signals a positive outlook. While there may be short-term overbought conditions, the overall momentum and volume support further upside potential. Therefore, investors can consider maintaining a bullish view on FUNL for the next few days.