Technical Analysis of FVD 2024-05-10
Overview:
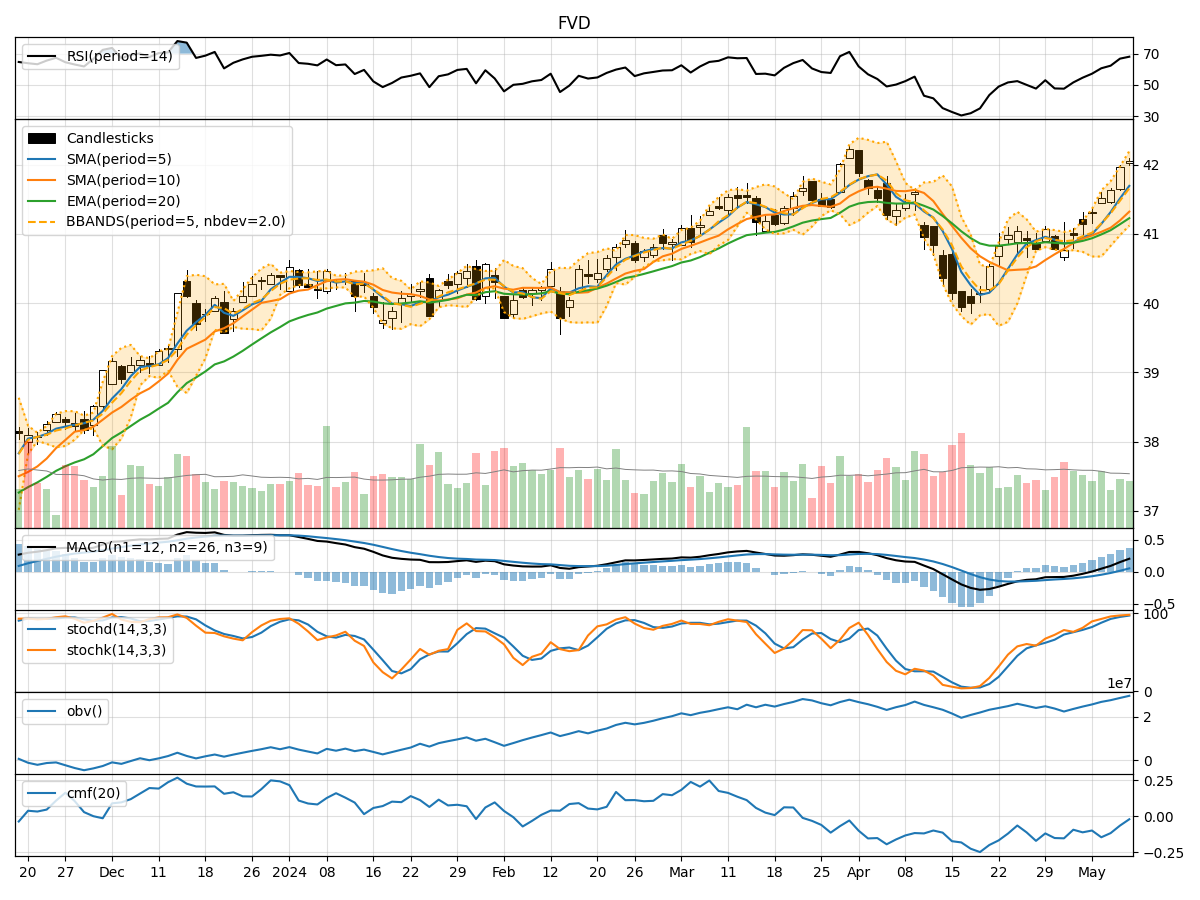
In analyzing the technical indicators for FVD over the last 5 days, we will delve into the trend, momentum, volatility, and volume indicators to provide a comprehensive outlook on the possible stock price movement in the coming days. By examining these key aspects, we aim to offer valuable insights and predictions for informed decision-making.
Trend Indicators:
- Moving Averages (MA): The 5-day Moving Average (MA) has been consistently increasing, indicating a bullish trend.
- MACD: The MACD line has been positive and rising, suggesting upward momentum.
- MACD Histogram: The MACD Histogram has been increasing, indicating strengthening bullish momentum.
Momentum Indicators:
- RSI: The Relative Strength Index (RSI) has been trending upwards, showing increasing buying pressure.
- Stochastic Oscillator: Both %K and %D have been in overbought territory, signaling a strong bullish momentum.
- Williams %R: The indicator has been in oversold territory, suggesting a potential reversal to the upside.
Volatility Indicators:
- Bollinger Bands: The stock price has been trading near the upper Bollinger Band, indicating high volatility and a potential overbought condition.
- Bollinger %B: The %B indicator has been fluctuating around 0.8, suggesting a strong bullish trend.
Volume Indicators:
- On-Balance Volume (OBV): The OBV has been steadily increasing, indicating accumulation by investors.
- Chaikin Money Flow (CMF): The CMF has been negative, suggesting some selling pressure in the stock.
Key Observations and Opinions:
- Trend: The trend indicators point towards a strong bullish sentiment in the stock.
- Momentum: Momentum indicators reflect a robust buying pressure and potential overbought conditions.
- Volatility: High volatility is observed, potentially signaling a period of increased price fluctuations.
- Volume: The increasing OBV indicates accumulation, but the negative CMF suggests some selling pressure.
Conclusion:
Based on the analysis of the technical indicators, the stock of FVD is strongly bullish in the short term. The trend is positive, momentum is robust, and volatility is high, indicating potential price swings. Investors should consider the overbought conditions highlighted by some indicators and monitor for potential reversals. Expect further upward movement in the stock price in the coming days.