Technical Analysis of FWD 2024-05-10
Overview:
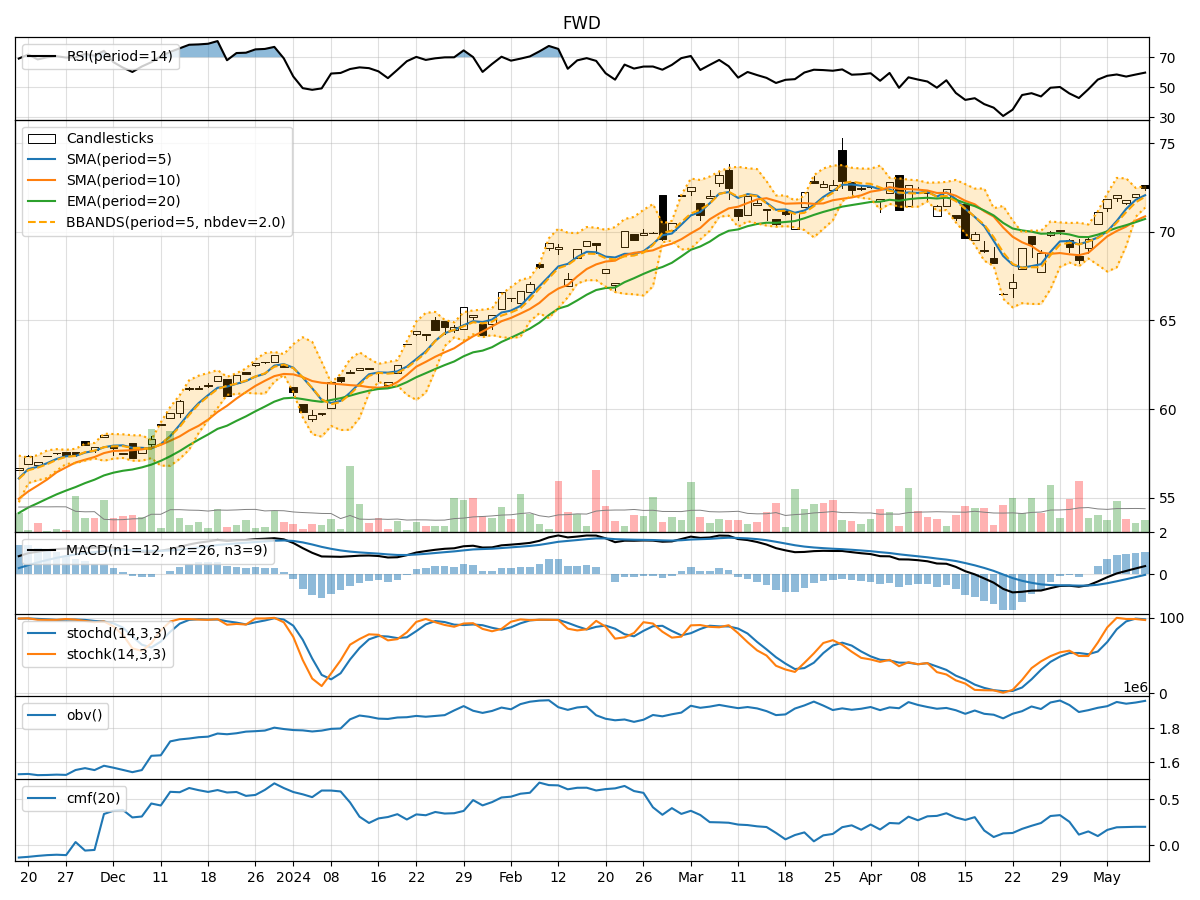
In analyzing the technical indicators for FWD stock over the last 5 days, we will delve into the trends, momentum, volatility, and volume indicators to provide a comprehensive outlook on the possible stock price movement in the coming days. By examining these key indicators, we aim to offer valuable insights and predictions for potential investors.
Trend Indicators:
- Moving Averages (MA): The 5-day moving average has been consistently rising, indicating a bullish trend in the short term.
- MACD (Moving Average Convergence Divergence): The MACD line has been above the signal line, suggesting a bullish momentum.
- MACD Histogram: The histogram has been increasing, indicating strengthening bullish momentum.
Momentum Indicators:
- RSI (Relative Strength Index): The RSI has been trending upwards, showing increasing buying pressure.
- Stochastic Oscillator: Both %K and %D have been relatively high, indicating a strong bullish momentum.
- Williams %R: The indicator has been in the oversold region, suggesting a potential reversal to the upside.
Volatility Indicators:
- Bollinger Bands: The stock price has been trading near the upper Bollinger Band, indicating high volatility and a potential overbought condition.
- Bollinger Band Width: The band width has been narrowing, suggesting a possible decrease in volatility.
Volume Indicators:
- On-Balance Volume (OBV): The OBV has shown mixed signals with fluctuations, indicating indecision among investors.
- Chaikin Money Flow (CMF): The CMF has been relatively stable, showing a neutral stance in terms of money flow.
Key Observations and Opinions:
- Trend: The stock is in an upward trend based on moving averages and MACD analysis.
- Momentum: Momentum indicators suggest a strong bullish momentum in the short term.
- Volatility: The stock is experiencing high volatility near the upper Bollinger Band.
- Volume: Volume indicators show mixed signals with no clear direction.
Conclusion:
Based on the analysis of the technical indicators, the next few days' possible stock price movement for FWD stock is likely to be upward with a bullish bias. Investors may consider entering long positions or holding onto existing positions to capitalize on the expected price appreciation. However, it is essential to monitor the stock closely for any signs of reversal or increased volatility.