Technical Analysis of FXA 2024-05-10
Overview:
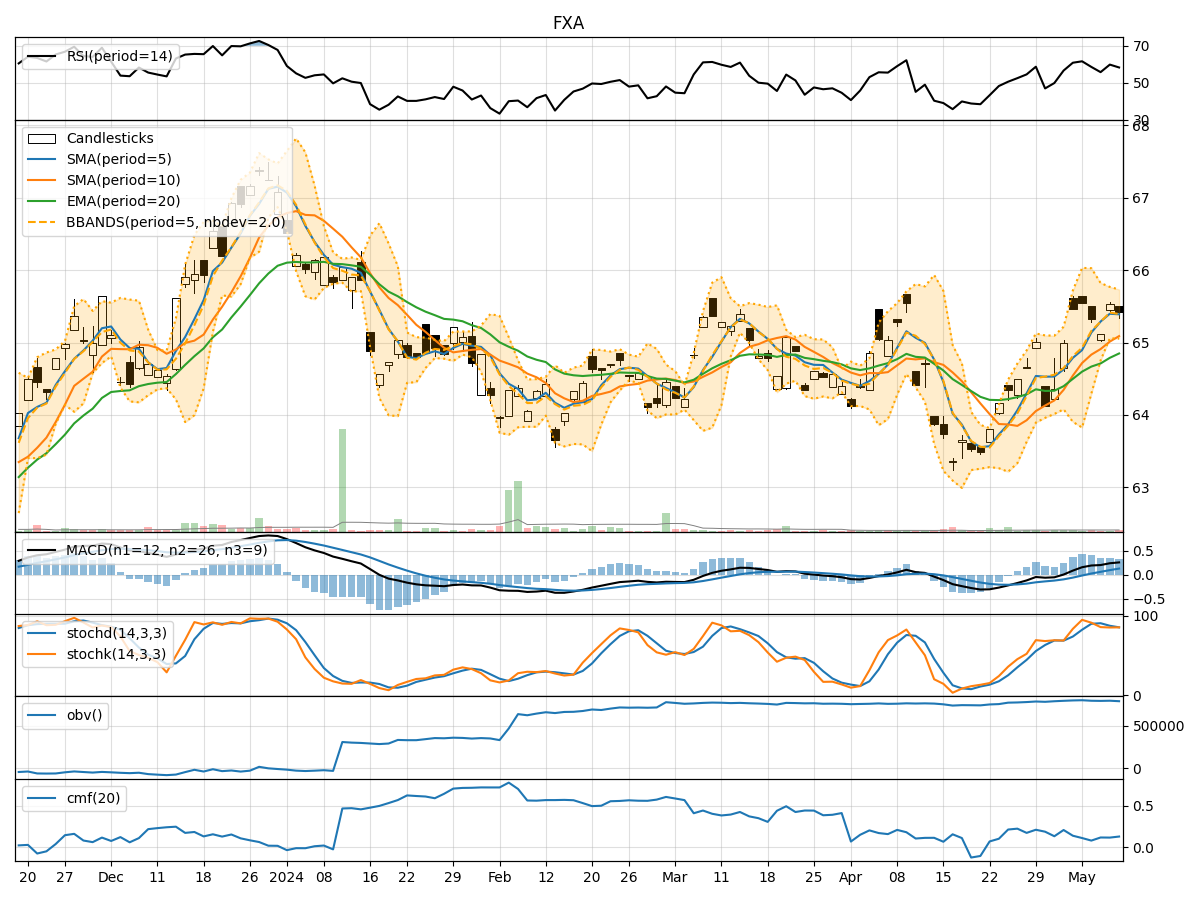
In analyzing the technical indicators for FXA over the last 5 days, we will delve into the trend, momentum, volatility, and volume indicators to provide a comprehensive outlook on the possible stock price movement in the coming days. By examining these key aspects, we aim to offer valuable insights and predictions for potential investors.
Trend Analysis:
- Moving Averages (MA): The 5-day MA has been consistently above the closing prices, indicating a bullish trend.
- MACD: The MACD line has been above the signal line, suggesting a positive momentum in the stock price.
Key Observation: The trend indicators point towards an upward movement in the stock price.
Momentum Analysis:
- RSI: The RSI values have been fluctuating around the 50 level, indicating a balanced momentum.
- Stochastic Oscillator: Both %K and %D values have been hovering around the overbought zone, suggesting a potential reversal.
Key Observation: The momentum indicators suggest a neutral stance in the stock price movement.
Volatility Analysis:
- Bollinger Bands (BB): The stock price has been trading within the bands, showing a stable volatility.
Key Observation: Volatility indicators signal a sideways movement in the stock price.
Volume Analysis:
- On-Balance Volume (OBV): The OBV values have been relatively stable, indicating a balanced buying and selling pressure.
- Chaikin Money Flow (CMF): The CMF values have been positive, reflecting a healthy inflow of money into the stock.
Key Observation: Volume indicators suggest a neutral sentiment in the stock price movement.
Conclusion:
Based on the analysis of the technical indicators, the overall outlook for FXA in the next few days is as follows: - Trend: Upward - Momentum: Neutral - Volatility: Sideways - Volume: Neutral
Recommendation:
Considering the bullish trend and stable volatility, investors may consider buying FXA in the short term. However, it is crucial to monitor the momentum indicators closely for any signs of a potential reversal. Additionally, diversifying the investment portfolio and setting stop-loss orders can help mitigate risks associated with market fluctuations.
In conclusion, while the trend indicators point towards an upward movement, it is essential to exercise caution and conduct further analysis before making investment decisions.