Technical Analysis of FXB 2024-05-10
Overview:
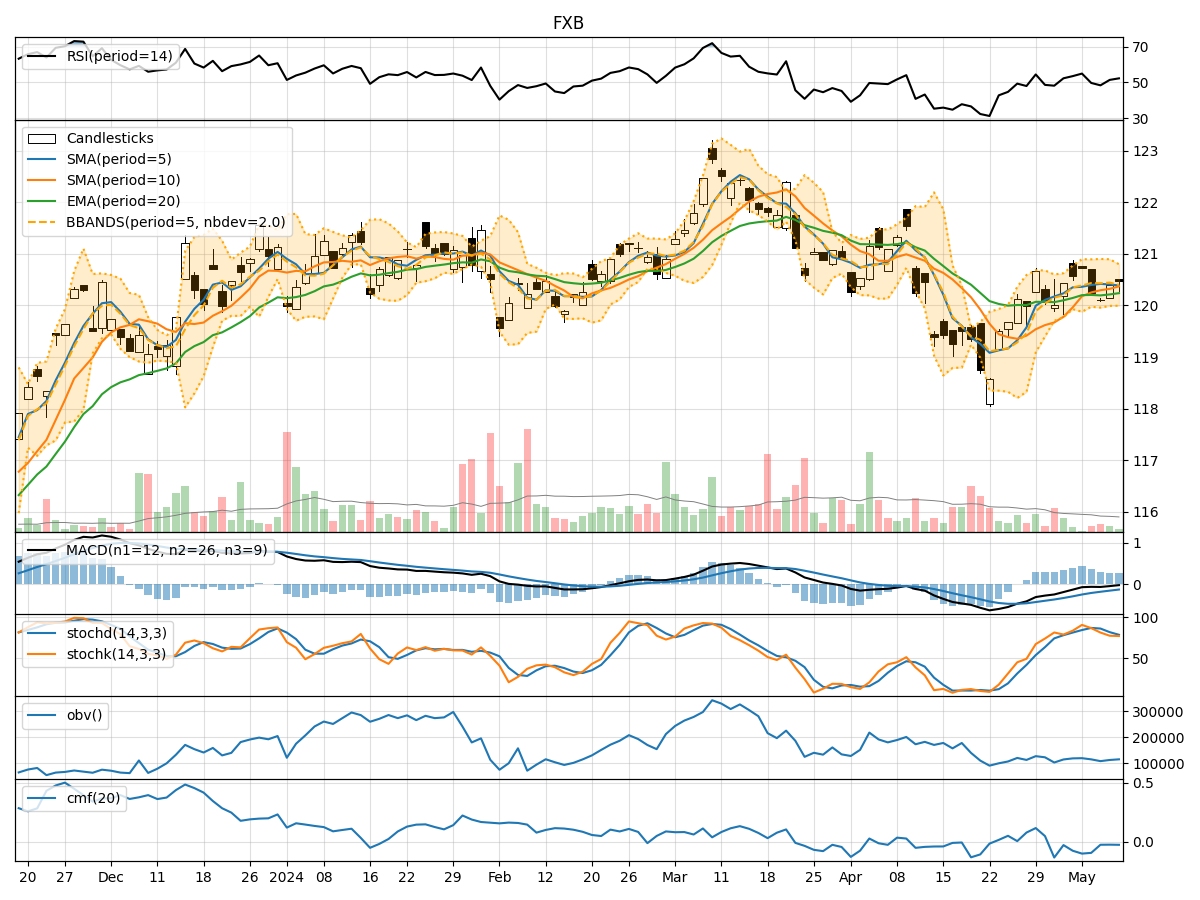
In analyzing the technical indicators for FXB over the last 5 days, we will delve into the trend, momentum, volatility, and volume indicators to provide a comprehensive outlook on the possible stock price movement in the coming days. By examining these key aspects, we aim to offer valuable insights and predictions to guide investment decisions.
Trend Indicators:
- Moving Averages (MA): The 5-day MA has been fluctuating around the closing prices, indicating short-term price trends. The SMA(10) and EMA(20) have shown slight variations but have not diverged significantly.
- MACD: The MACD line has been consistently below the signal line, suggesting a bearish trend. However, the MACD histogram has shown signs of convergence in recent days.
Momentum Indicators:
- RSI: The RSI has been hovering around the neutral zone, indicating a lack of strong momentum in either direction.
- Stochastic Oscillator: Both %K and %D have been fluctuating, reflecting indecision in the market.
- Williams %R: The indicator has been moving in and out of the oversold territory, signaling potential reversals.
Volatility Indicators:
- Bollinger Bands: The bands have been narrowing, indicating decreasing volatility and a potential period of consolidation.
- Bollinger %B: The %B indicator has been fluctuating within a range, suggesting a lack of clear trend direction.
Volume Indicators:
- On-Balance Volume (OBV): The OBV has shown a slight decline, indicating some selling pressure in the market.
- Chaikin Money Flow (CMF): The CMF has been negative, reflecting a lack of strong buying interest.
Key Observations and Opinions:
- Trend: The trend indicators suggest a neutral to slightly bearish outlook in the short term.
- Momentum: Momentum indicators indicate a lack of strong momentum in either direction, signaling potential consolidation.
- Volatility: Volatility indicators point towards decreasing volatility and a possible period of consolidation.
- Volume: Volume indicators show a slight decline in buying interest, potentially impacting price movements.
Conclusion:
Based on the analysis of the technical indicators, the next few days for FXB are likely to see sideways movement with a slight bearish bias. Traders should exercise caution and wait for clearer signals before making significant trading decisions. It is advisable to monitor key support and resistance levels closely to gauge potential breakout or breakdown scenarios.