Technical Analysis of FXD 2024-05-10
Overview:
In analyzing the technical indicators for FXD over the last 5 days, we will delve into the trend, momentum, volatility, and volume indicators to provide a comprehensive outlook on the possible stock price movement in the coming days. By examining these key indicators, we aim to offer valuable insights and predictions for potential investors.
Trend Analysis:
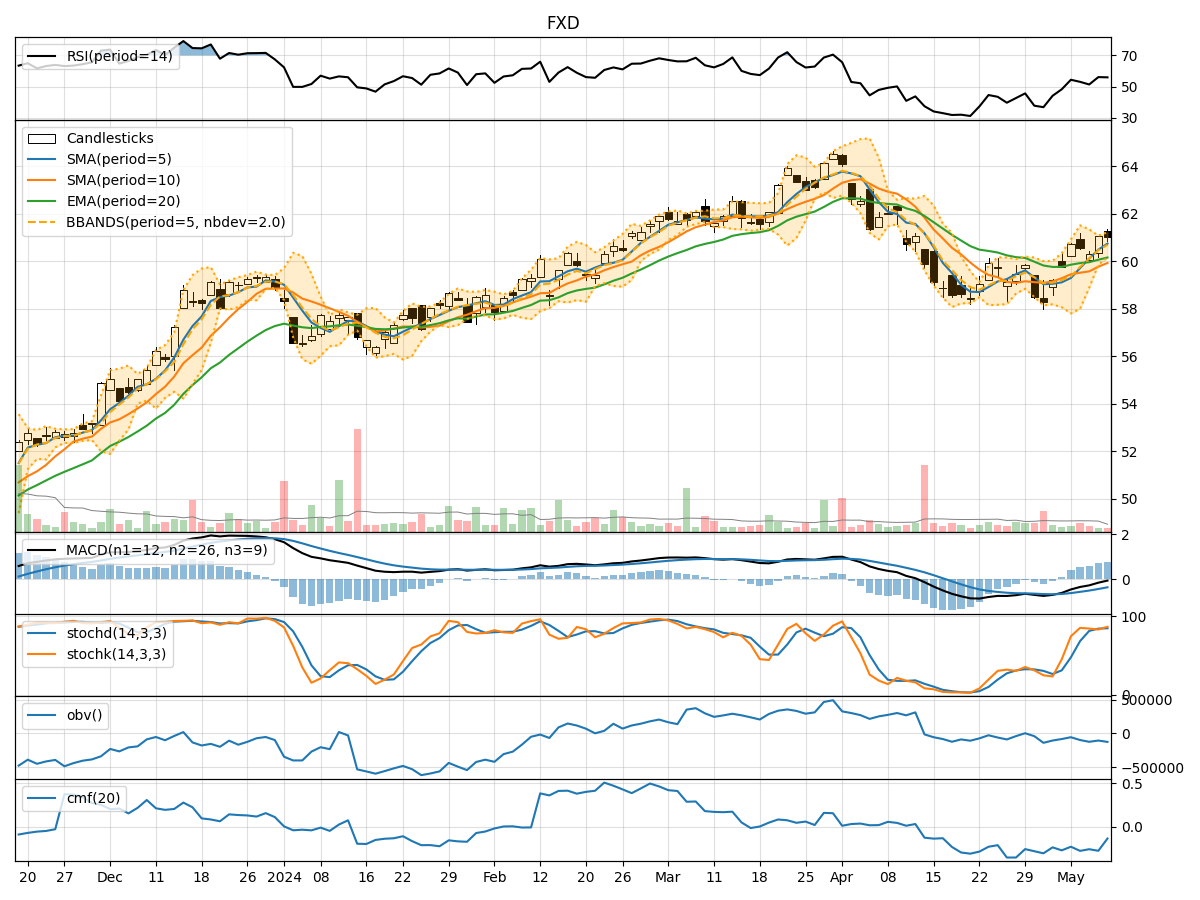
- Moving Averages (MA): The 5-day MA has been consistently rising, indicating a bullish trend in the short term.
- MACD: The MACD line has been gradually increasing, while the MACD histogram has shown positive values, suggesting a strengthening bullish momentum.
- Relative Strength Index (RSI): The RSI has been fluctuating but remains within the neutral zone, indicating a balanced market sentiment.
Momentum Analysis:
- Stochastic Oscillator: Both %K and %D have been in the overbought territory, signaling a potential reversal or consolidation.
- Williams %R (WillR): The WillR indicator has been hovering in the oversold region, suggesting a possible buying opportunity.
Volatility Analysis:
- Bollinger Bands (BB): The price has been trading within the bands, indicating a period of consolidation and potential breakout.
- Bollinger %B (BBP): The %B indicator has been fluctuating around the midline, reflecting uncertainty in price direction.
Volume Analysis:
- On-Balance Volume (OBV): The OBV has shown mixed movements, indicating indecision among market participants.
- Chaikin Money Flow (CMF): The CMF has been negative, suggesting selling pressure in the market.
Key Observations:
- The trend indicators suggest a bullish bias in the short term.
- Momentum indicators point towards a potential reversal or consolidation phase.
- Volatility indicators indicate a period of consolidation with a potential breakout.
- Volume indicators reflect mixed sentiments among investors.
Conclusion:
Based on the analysis of the technical indicators, the next few days' possible stock price movement for FXD is likely to experience a period of consolidation with a potential bullish breakout. Traders should closely monitor key levels and wait for confirmation of a sustained uptrend before considering long positions. Exercise caution as the market dynamics may shift rapidly, and it is essential to adapt to changing conditions.