Technical Analysis of FXE 2024-05-10
Overview:
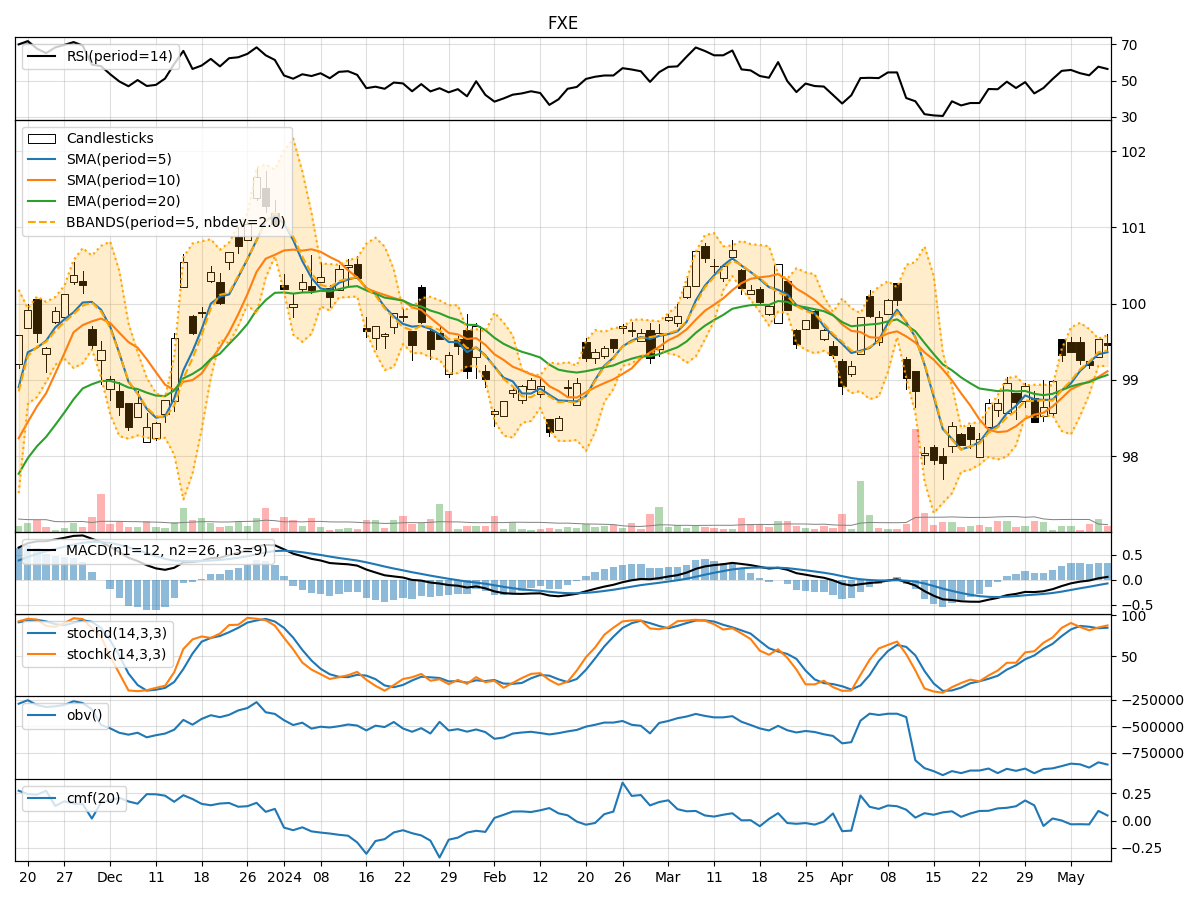
In analyzing the technical indicators for FXE over the last 5 days, we will delve into the trends, momentum, volatility, and volume aspects to provide a comprehensive outlook on the possible stock price movement in the coming days.
Trend Analysis:
- Moving Averages (MA): The 5-day Moving Average (MA) has been consistently above the Simple Moving Average (SMA) and Exponential Moving Average (EMA), indicating a bullish trend.
- MACD: The Moving Average Convergence Divergence (MACD) has shown positive values, with the MACD line consistently above the Signal line, suggesting a bullish momentum.
Momentum Analysis:
- RSI: The Relative Strength Index (RSI) has been fluctuating around the mid-level, indicating a neutral momentum.
- Stochastic Oscillator: Both %K and %D have been in the overbought zone, suggesting a potential reversal or consolidation.
Volatility Analysis:
- Bollinger Bands (BB): The price has mostly stayed within the Bollinger Bands, with the bands narrowing, indicating decreasing volatility.
Volume Analysis:
- On-Balance Volume (OBV): The OBV has shown mixed signals, with some days experiencing selling pressure and others showing accumulation.
- Chaikin Money Flow (CMF): The CMF has been negative, indicating a lack of buying pressure.
Key Observations:
- The trend indicators suggest a bullish sentiment in the short term.
- Momentum indicators show a neutral stance with a possibility of a reversal.
- Volatility has been decreasing, indicating a potential period of consolidation.
- Volume indicators reflect mixed signals with no clear accumulation or distribution pattern.
Conclusion:
Based on the analysis of the technical indicators, the next few days for FXE could see sideways movement with a slight bullish bias. Traders should closely monitor the stochastic oscillator for potential reversal signals and keep an eye on the RSI for any shifts in momentum. Additionally, the narrowing Bollinger Bands suggest a period of consolidation, while the OBV and CMF indicate a lack of strong buying pressure. Overall, a cautious approach with a focus on key reversal signals is recommended in the current market environment.