Technical Analysis of FXG 2024-05-10
Overview:
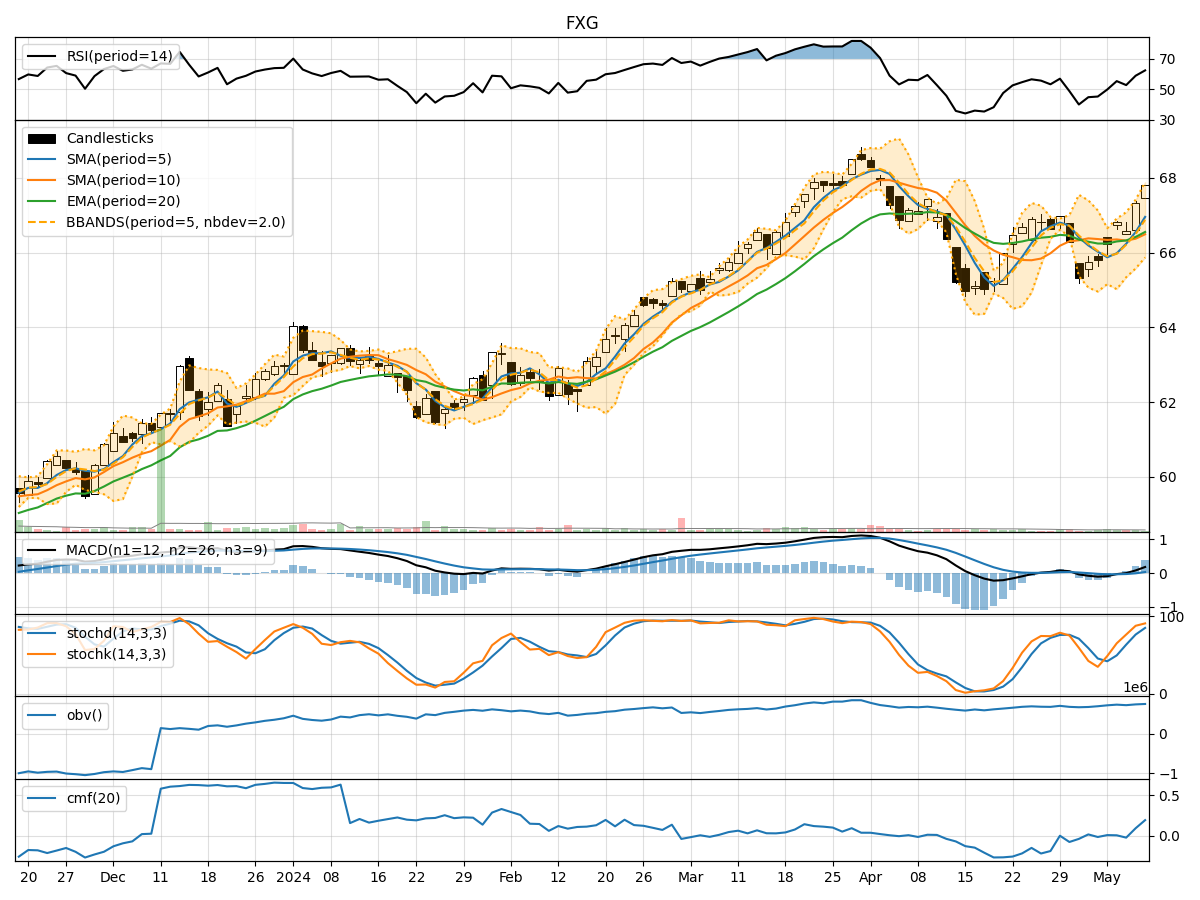
In analyzing the technical indicators for FXG over the last 5 days, we will delve into the trend, momentum, volatility, and volume indicators to provide a comprehensive outlook on the possible stock price movement in the coming days. By examining these key indicators, we aim to offer valuable insights and predictions for potential investors.
Trend Indicators:
- Moving Averages (MA): The 5-day MA has been fluctuating around the closing prices, indicating short-term price trends. The SMA(10) and EMA(20) have shown a slight upward trend, suggesting a positive momentum.
- MACD: The MACD line has been consistently above the signal line, indicating a bullish trend. The MACD histogram has been increasing, signaling strengthening bullish momentum.
Momentum Indicators:
- RSI: The RSI has been oscillating around the 50 level, indicating a neutral stance in momentum.
- Stochastic Oscillator: Both %K and %D have been in the overbought zone, suggesting a potential reversal or consolidation.
- Williams %R: The Williams %R has been hovering near the oversold territory, indicating a possible buying opportunity.
Volatility Indicators:
- Bollinger Bands (BB): The price has been trading within the bands, with the upper band expanding slightly, indicating increased volatility.
- Bollinger %B: The %B indicator has been fluctuating around 0.8, suggesting a relatively high price level compared to the bands.
Volume Indicators:
- On-Balance Volume (OBV): The OBV has shown a slight increase, indicating buying pressure in the stock.
- Chaikin Money Flow (CMF): The CMF has been positive, reflecting a bullish money flow into the stock.
Key Observations and Opinions:
- Trend: The trend indicators suggest a bullish sentiment with the moving averages trending upwards and the MACD signaling a strong bullish momentum.
- Momentum: The momentum indicators show mixed signals with the RSI neutral, Stochastic in the overbought zone, and Williams %R near oversold levels, indicating a potential reversal or consolidation.
- Volatility: The volatility indicators point towards an increase in price fluctuations, potentially leading to more significant price movements.
- Volume: The volume indicators indicate a positive buying pressure in the stock, supported by the OBV and CMF.
Conclusion:
Based on the analysis of the technical indicators, the next few days' possible stock price movement for FXG is likely to be bullish. The trend indicators support a bullish outlook, while the momentum indicators suggest a potential consolidation or reversal. The increased volatility may lead to significant price movements, and the positive volume indicators indicate strong buying interest in the stock. Investors should consider entering long positions with caution, monitoring key support and resistance levels for potential profit-taking opportunities.