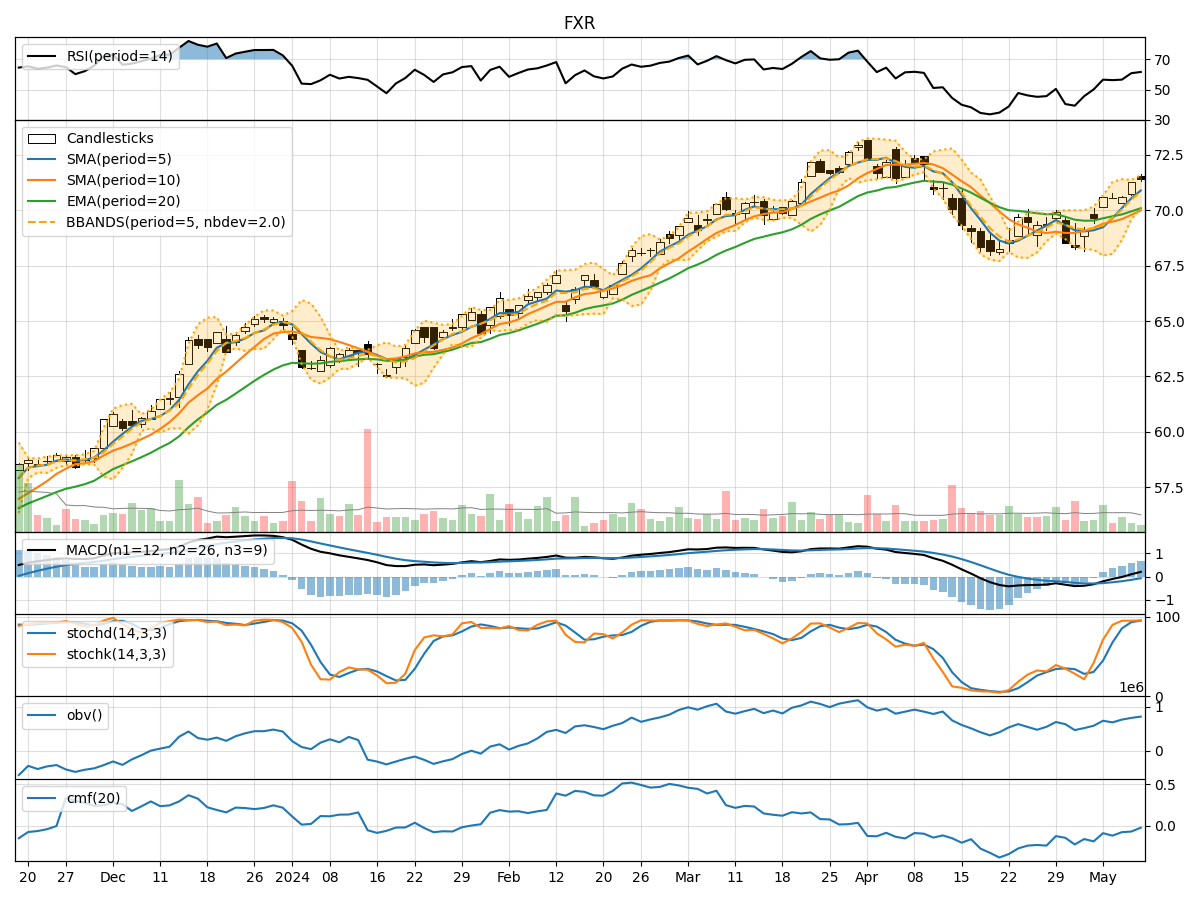
Technical Analysis of FXR 2024-05-10
Overview:
In analyzing the technical indicators for FXR over the last 5 days, we will delve into the trend, momentum, volatility, and volume indicators to provide a comprehensive outlook on the possible stock price movement in the coming days. By examining these key indicators, we aim to offer valuable insights and predictions for potential investors.
Trend Indicators:
- Moving Averages (MA): The 5-day moving average has been consistently rising, indicating a bullish trend in the short term.
- MACD: The MACD line has been increasing, crossing above the signal line, suggesting a bullish momentum.
- MACD Histogram: The histogram has been rising, indicating strengthening bullish momentum.
Key Observation: The trend indicators point towards a bullish sentiment in the stock price movement.
Momentum Indicators:
- RSI: The RSI has been increasing, reaching above 50, indicating a strengthening bullish momentum.
- Stochastic Oscillator: Both %K and %D lines are in the overbought zone, suggesting a potential reversal or consolidation.
- Williams %R: The indicator is in the oversold territory, signaling a potential buying opportunity.
Key Observation: Momentum indicators show a mixed signal with overbought conditions, potentially leading to a short-term correction or consolidation.
Volatility Indicators:
- Bollinger Bands: The price has been trading within the bands, indicating normal volatility.
- Bollinger %B: The %B is above 0.8, suggesting the price is nearing the upper band and may be overbought.
Key Observation: Volatility indicators suggest normal price fluctuations with a potential overbought condition.
Volume Indicators:
- On-Balance Volume (OBV): The OBV has been increasing, indicating accumulation by investors.
- Chaikin Money Flow (CMF): The CMF is negative, suggesting selling pressure in the market.
Key Observation: Volume indicators show conflicting signals with OBV indicating accumulation and CMF signaling distribution.
Conclusion:
Based on the analysis of the technical indicators, the stock price of FXR is likely to experience short-term consolidation or a minor correction due to the mixed signals from momentum and volume indicators despite the bullish trend indicated by moving averages and MACD. Traders should exercise caution and consider potential profit-taking opportunities in the near future.