Technical Analysis of FXZ 2024-05-10
Overview:
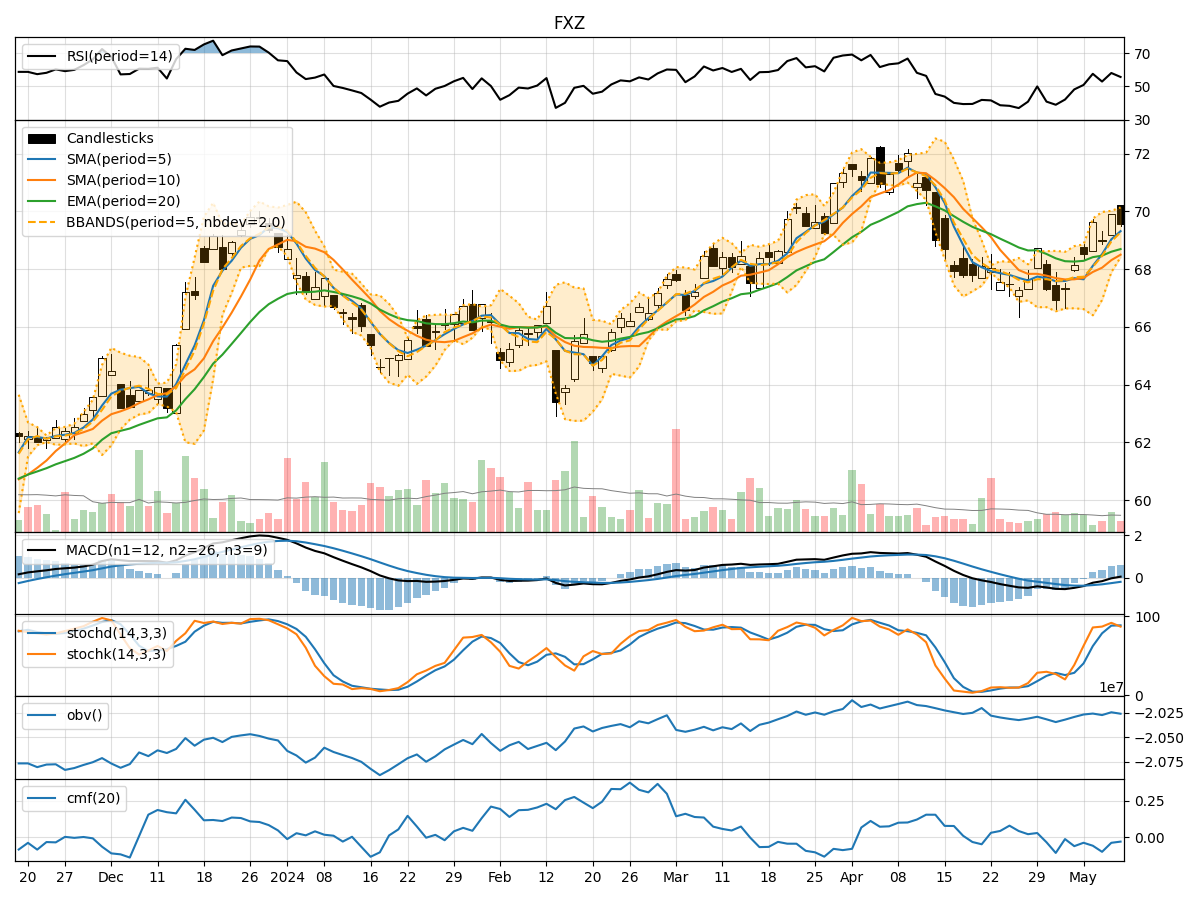
In analyzing the technical indicators for FXZ stock over the last 5 days, we will delve into the trends, momentum, volatility, and volume aspects to provide a comprehensive outlook on the possible stock price movement in the coming days. By examining key indicators such as moving averages, MACD, RSI, Bollinger Bands, and OBV, we aim to offer valuable insights and predictions for potential price action.
Trend Analysis:
- Moving Averages (MA): The 5-day MA has been trending upwards, indicating a positive short-term momentum in the stock price.
- MACD: The MACD line has been consistently above the signal line, suggesting a bullish trend in the stock.
- EMA: The EMA has been gradually increasing, reflecting a positive price trend.
Momentum Analysis:
- RSI: The RSI has been fluctuating around the neutral zone, indicating a balanced momentum in the stock.
- Stochastic Oscillator: Both %K and %D have been in the overbought territory, signaling a potential reversal or consolidation.
- Williams %R: The Williams %R is showing oversold conditions, suggesting a possible bullish reversal.
Volatility Analysis:
- Bollinger Bands: The stock price has been trading within the Bollinger Bands, indicating a period of consolidation.
- Bollinger %B: The %B indicator is below 1, suggesting the stock is trading below the upper band and may see a potential uptrend.
Volume Analysis:
- On-Balance Volume (OBV): The OBV has been fluctuating, indicating mixed buying and selling pressure in the stock.
- Chaikin Money Flow (CMF): The CMF is negative, suggesting a bearish sentiment in the stock.
Conclusion:
Based on the analysis of the technical indicators, the stock is likely to experience sideways consolidation in the next few days. The moving averages and MACD signal a bullish trend, while the stochastic oscillator and Williams %R indicate a potential reversal or consolidation. The Bollinger Bands suggest a period of consolidation, and the OBV and CMF reflect mixed sentiment in the market. Therefore, it is recommended to exercise caution and closely monitor the price action for any potential breakout or reversal signals before making trading decisions.