Technical Analysis of FYC 2024-05-10
Overview:
In analyzing the provided Technical Analysis (TA) data for the last 5 days, we will delve into the trend, momentum, volatility, and volume indicators to forecast the possible stock price movement for the next few days. By examining these key indicators, we aim to provide a comprehensive and insightful prediction backed by data-driven analysis.
Trend Indicators:
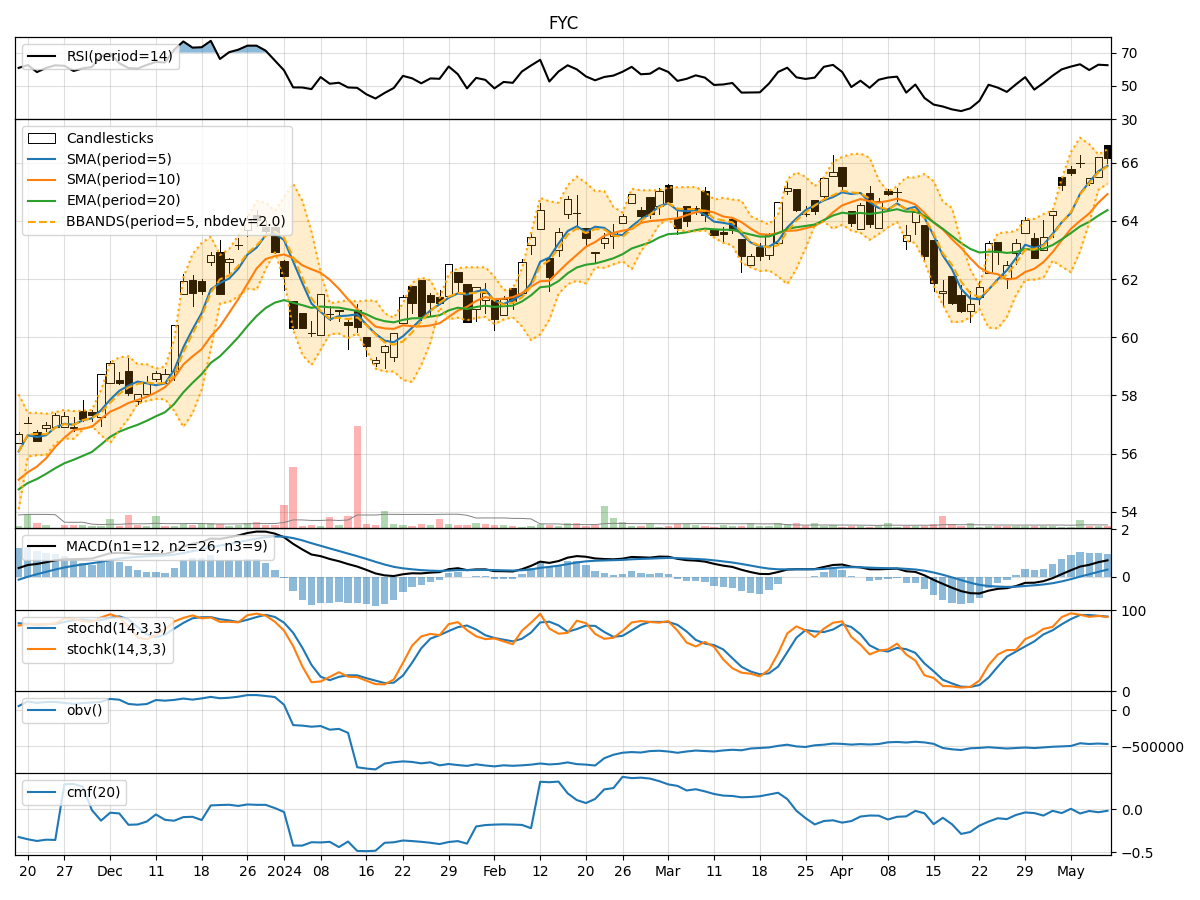
- Moving Averages (MA): The 5-day Moving Average (MA) has been consistently above the Simple Moving Average (SMA) and Exponential Moving Average (EMA), indicating a bullish trend.
- MACD: The MACD line has been consistently positive, with the MACD Histogram showing an increasing trend, suggesting bullish momentum.
Momentum Indicators:
- RSI: The Relative Strength Index (RSI) has been in the overbought territory, indicating a strong bullish momentum.
- Stochastic Oscillator: Both %K and %D have been relatively high, suggesting a bullish sentiment.
Volatility Indicators:
- Bollinger Bands (BB): The stock price has been consistently trading near the upper Bollinger Band, indicating high volatility and potential overbought conditions.
Volume Indicators:
- On-Balance Volume (OBV): The OBV has shown a slight increase, indicating buying pressure.
- Chaikin Money Flow (CMF): The CMF has been negative, suggesting some distribution in the stock.
Key Observations:
- The trend indicators, momentum indicators, and volume indicators all point towards a bullish sentiment in the stock.
- However, the high RSI and overbought conditions indicated by the Bollinger Bands suggest a potential pullback or consolidation in the near future.
- The negative CMF indicates some selling pressure despite the overall bullish trend.
Conclusion:
Based on the analysis of the technical indicators, the stock is currently in an overbought state with strong bullish momentum. However, the high RSI and proximity to the upper Bollinger Band suggest a potential pullback or consolidation in the coming days. Traders should exercise caution and consider taking profits or implementing risk management strategies in anticipation of a short-term correction.