Technical Analysis of FYLD 2024-05-10
Overview:
In analyzing the technical indicators for FYLD over the last 5 days, we will delve into the trend, momentum, volatility, and volume indicators to provide a comprehensive outlook on the possible stock price movement in the coming days. By examining these key indicators, we aim to offer valuable insights and predictions for potential investors.
Trend Indicators:
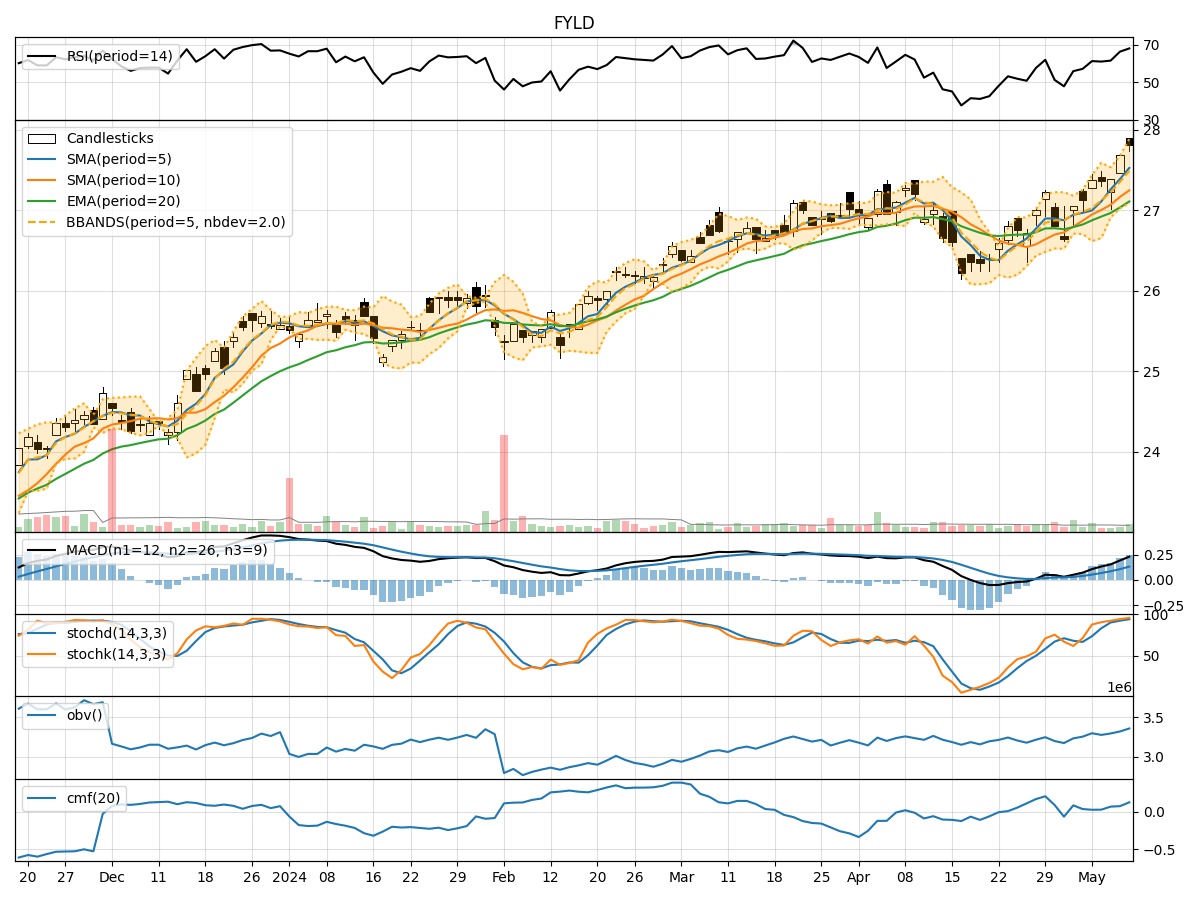
- Moving Averages (MA): The 5-day moving average has been consistently above the simple moving average (SMA) and exponential moving average (EMA), indicating a bullish trend.
- MACD: The MACD line has been consistently above the signal line, with both lines showing an upward trajectory, suggesting a bullish momentum.
- MACD Histogram: The histogram has been increasing over the past 5 days, indicating strengthening bullish momentum.
Momentum Indicators:
- RSI: The Relative Strength Index (RSI) has been trending upwards and is currently in the overbought territory, suggesting a strong bullish momentum.
- Stochastic Oscillator: Both %K and %D lines of the Stochastic Oscillator are in the overbought zone, indicating a strong bullish momentum.
- Williams %R: The Williams %R is in the oversold region, suggesting a potential reversal in the short term.
Volatility Indicators:
- Bollinger Bands: The stock price has been trading within the upper Bollinger Band, indicating an overbought condition.
- Bollinger Band Width: The Band Width has been narrowing, suggesting a decrease in volatility.
- Bollinger Band %B: The %B indicator is above 0.8, indicating a potential overbought condition.
Volume Indicators:
- On-Balance Volume (OBV): The OBV has been trending upwards, indicating accumulation by investors.
- Chaikin Money Flow (CMF): The CMF is positive and has been increasing, suggesting buying pressure in the stock.
Conclusion:
Based on the analysis of the technical indicators, the stock price of FYLD is likely to experience a continuation of the bullish trend in the coming days. The trend indicators, momentum indicators, and volume indicators all point towards a strong bullish sentiment in the market. However, caution should be exercised as some indicators, such as the Williams %R and Bollinger Bands, suggest a potential overbought condition and a short-term reversal may be on the horizon.
Recommendation:
Investors should consider buying on dips or waiting for a pullback to enter long positions. It is essential to monitor the price action closely and set appropriate stop-loss levels to manage risk effectively. Overall, the outlook for FYLD appears bullish in the near term, but vigilance and prudent risk management are crucial in navigating the market dynamics.