Technical Analysis of FYLG 2024-05-10
Overview:
In analyzing the technical indicators for FYLG over the last 5 days, we will delve into the trends, momentum, volatility, and volume aspects to provide a comprehensive outlook on the possible stock price movement. By examining these key indicators, we aim to offer valuable insights and predictions for the upcoming days.
Trend Analysis:
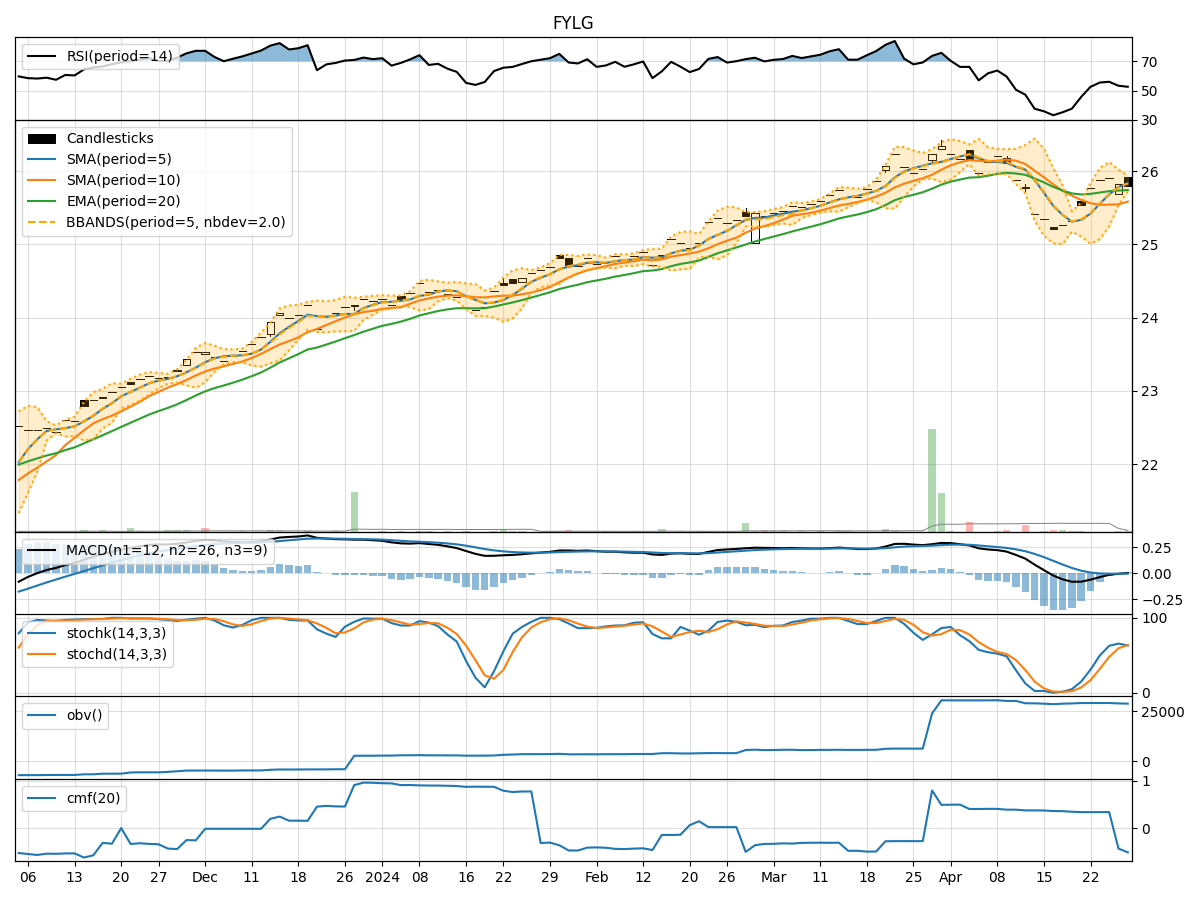
- Moving Averages (MA): The 5-day MA has been consistently above the closing prices, indicating a bullish trend.
- MACD: The MACD line has been above the signal line, suggesting a bullish momentum.
- RSI: The RSI values have been increasing, indicating strengthening bullish momentum.
Key Observation: The trend indicators point towards a bullish sentiment in the stock price movement.
Momentum Analysis:
- Stochastic Oscillator: Both %K and %D values have been at or near 100%, signaling strong bullish momentum.
- RSI: The RSI values have been increasing, indicating growing buying pressure.
Key Observation: Momentum indicators reflect a strong bullish sentiment in the stock.
Volatility Analysis:
- Bollinger Bands (BB): The bands have been widening, suggesting increased volatility.
- Bollinger %B: The %B values have been fluctuating within a moderate range.
Key Observation: Volatility indicators show increased volatility in the stock price.
Volume Analysis:
- On-Balance Volume (OBV): The OBV values have been increasing, indicating accumulation.
- Chaikin Money Flow (CMF): The CMF values have been negative, suggesting selling pressure.
Key Observation: Volume indicators present a mixed signal with accumulation in OBV but selling pressure in CMF.
Conclusion:
Based on the analysis of the technical indicators, the next few days' possible stock price movement for FYLG is likely to be upward. The bullish trend and momentum indicators, coupled with increased volatility, suggest a potential continuation of the upward trajectory. However, the conflicting signals in volume indicators warrant caution, as selling pressure indicated by CMF could potentially impact the price movement.
Recommendation:
Considering the overall bullish sentiment in trend and momentum indicators, investors may consider buying opportunities in FYLG for the next few days. It is essential to monitor volume indicators closely to gauge the strength of the buying pressure and potential reversals in the stock price movement. As always, risk management strategies should be in place to mitigate any unforeseen market fluctuations.