Technical Analysis of FYT 2024-05-10
Overview:
In analyzing the technical indicators for FYT stock over the last 5 days, we will delve into the trend, momentum, volatility, and volume indicators to provide a comprehensive outlook on the possible stock price movement in the upcoming days. By examining these key indicators, we aim to offer valuable insights and predictions to guide investment decisions.
Trend Indicators:
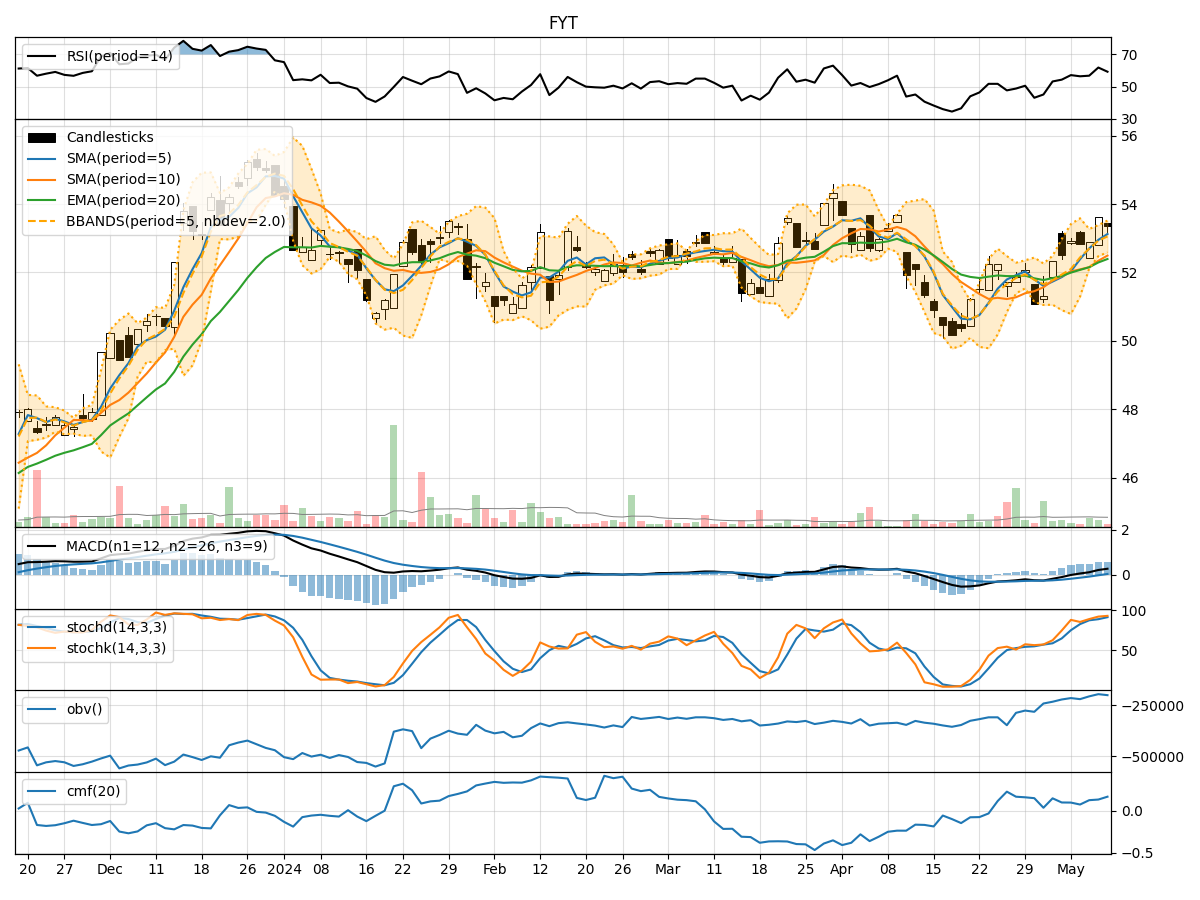
- Moving Averages (MA): The 5-day Moving Average has been consistently above the Simple Moving Average (SMA) and Exponential Moving Average (EMA), indicating a bullish trend.
- MACD: The MACD line has been consistently above the signal line, with both lines showing an upward trend, suggesting bullish momentum.
- MACD Histogram: The MACD Histogram has been increasing over the past few days, indicating strengthening bullish momentum.
Momentum Indicators:
- RSI: The Relative Strength Index (RSI) has been fluctuating but generally staying within the neutral to overbought territory, suggesting a balanced momentum.
- Stochastic Oscillator: Both %K and %D lines of the Stochastic Oscillator have been in the overbought zone, indicating a potential reversal or consolidation.
- Williams %R: The Williams %R has been fluctuating but recently dipped into the oversold territory, signaling a possible buying opportunity.
Volatility Indicators:
- Bollinger Bands: The stock price has been trading within the Bollinger Bands, with the bands narrowing slightly, indicating decreasing volatility.
- Bollinger %B: The %B indicator has been hovering around 0.7, suggesting the stock is trading closer to the upper band.
Volume Indicators:
- On-Balance Volume (OBV): The OBV has been showing a slight increase over the past few days, indicating accumulation by investors.
- Chaikin Money Flow (CMF): The CMF has been positive, indicating buying pressure in the stock.
Key Observations:
- The trend indicators suggest a strong bullish sentiment in the stock.
- Momentum indicators show a mix of overbought and oversold signals, indicating a potential reversal or consolidation.
- Volatility indicators point towards decreasing volatility in the stock.
- Volume indicators indicate a slight increase in buying pressure.
Conclusion:
Based on the analysis of the technical indicators, the stock is likely to continue its upward movement in the next few days. The bullish trend, supported by the MACD and moving averages, suggests that buyers are in control. However, caution is advised as the momentum indicators show signs of potential reversal or consolidation. Traders should closely monitor the Stochastic Oscillator and Williams %R for any shifts in momentum. Overall, the outlook for FYT stock remains bullish in the short term.