Technical Analysis of FYX 2024-05-10
Overview:
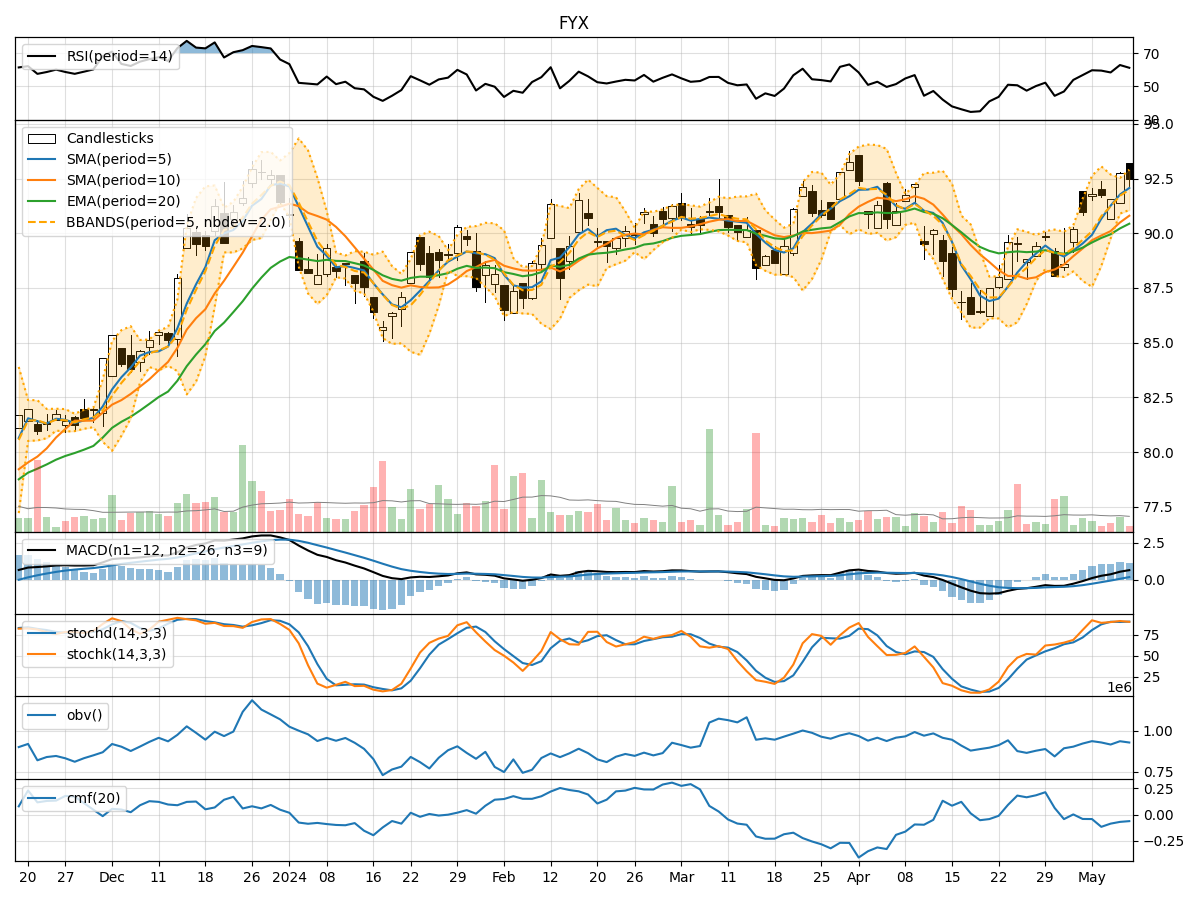
In analyzing the technical indicators for the stock represented by FYX over the last 5 days, we will delve into the trend, momentum, volatility, and volume indicators to provide a comprehensive outlook on the possible stock price movement in the upcoming days.
Trend Analysis:
- Moving Averages (MA): The 5-day Moving Average has been consistently rising, indicating a bullish trend in the short term.
- MACD: The MACD line has been above the signal line for the past few days, suggesting a bullish momentum.
- RSI: The Relative Strength Index has been fluctuating around the 60-65 range, indicating a neutral to slightly bullish sentiment.
Momentum Analysis:
- Stochastic Oscillator: Both %K and %D have been hovering around the overbought territory, suggesting a potential reversal or consolidation.
- Williams %R: The Williams %R indicator has been in the oversold region, indicating a potential buying opportunity.
Volatility Analysis:
- Bollinger Bands: The stock price has been trading within the bands, with the upper band acting as a resistance level.
- BB% (Bollinger Band %B): The %B indicator has been fluctuating around 0.7-0.9, indicating high volatility.
Volume Analysis:
- On-Balance Volume (OBV): The OBV has been relatively stable, suggesting a balance between buying and selling pressure.
- Chaikin Money Flow (CMF): The CMF has been negative, indicating a bearish money flow trend.
Key Observations:
- The trend indicators suggest a bullish sentiment in the short term.
- Momentum indicators show a potential reversal or consolidation in the near future.
- Volatility remains high, indicating potential price swings.
- Volume indicators point towards a slightly bearish money flow trend.
Conclusion:
Based on the analysis of the technical indicators, the stock is likely to experience sideways consolidation in the upcoming days. Traders should exercise caution and wait for clearer signals before making significant trading decisions. The stock may trade within a narrow range with limited upside potential in the short term. It is advisable to closely monitor key support and resistance levels for potential breakout opportunities.