Technical Analysis of GAMR 2024-05-10
Overview:
In the last 5 trading days, GAMR stock has shown a mixed performance based on various technical indicators. We will analyze the trend, momentum, volatility, and volume indicators to determine the possible stock price movement in the next few days.
Trend Indicators:
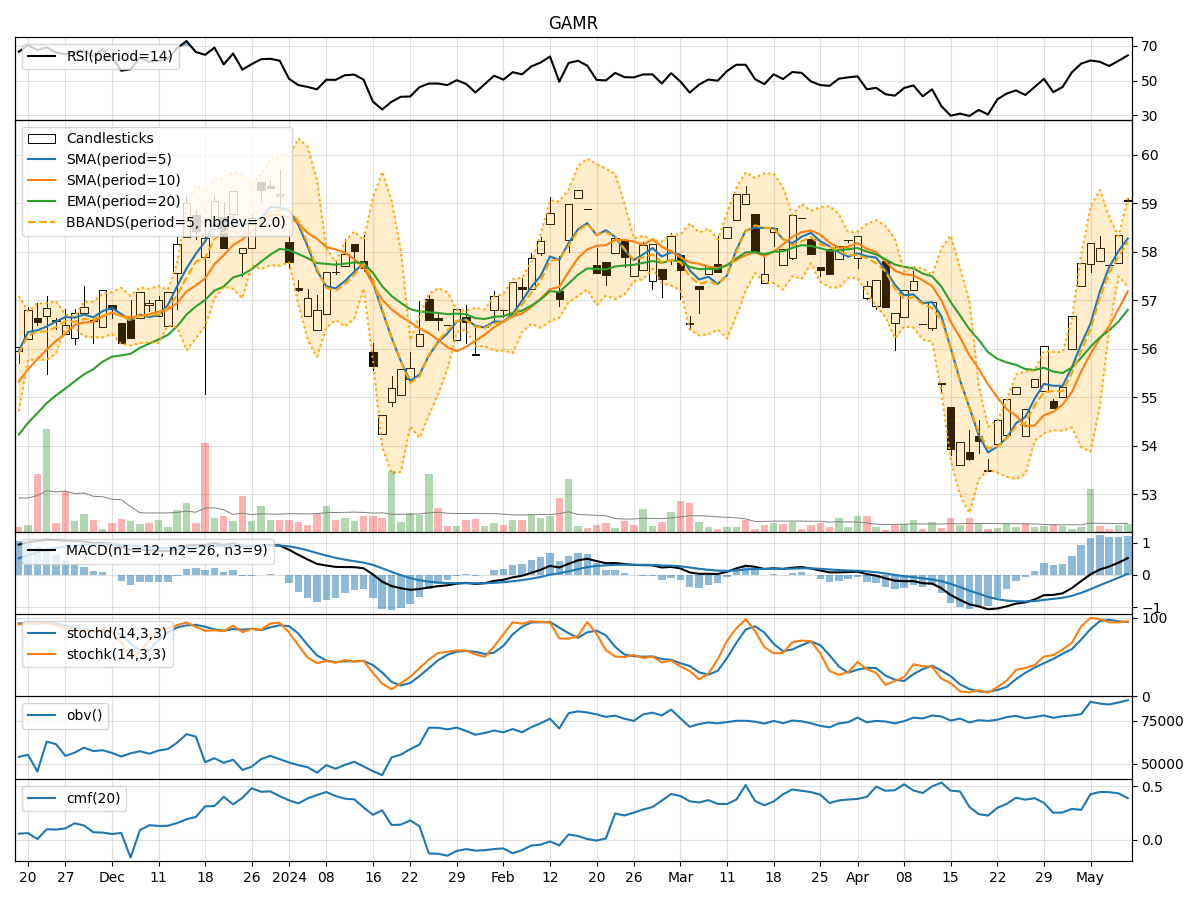
- Moving Averages (MA): The 5-day Moving Average has been consistently above the Simple Moving Average (SMA) and Exponential Moving Average (EMA), indicating a bullish trend.
- MACD: The MACD line has been above the signal line, with both lines showing an upward trend, suggesting bullish momentum.
- MACD Histogram: The MACD Histogram has been increasing, indicating strengthening bullish momentum.
Momentum Indicators:
- RSI: The Relative Strength Index (RSI) has been fluctuating around the overbought territory, suggesting a strong bullish momentum.
- Stochastic Oscillator: Both %K and %D lines of the Stochastic Oscillator have been in the overbought zone, indicating a strong bullish momentum.
- Williams %R: The Williams %R has been hovering near the oversold territory, indicating a potential reversal to the upside.
Volatility Indicators:
- Bollinger Bands: The stock price has been trading within the Bollinger Bands, with the bands widening slightly, indicating increased volatility.
- Bollinger %B: The %B indicator has been fluctuating within the bands, suggesting potential price reversals.
Volume Indicators:
- On-Balance Volume (OBV): The OBV has been showing a positive trend, indicating accumulation by investors.
- Chaikin Money Flow (CMF): The CMF has been positive, suggesting buying pressure in the stock.
Key Observations:
- The trend indicators suggest a strong bullish sentiment with moving averages and MACD signaling an upward trend.
- Momentum indicators indicate a strong bullish momentum, with RSI and Stochastic Oscillator in the overbought zone.
- Volatility indicators show increased volatility, which could lead to potential price swings.
- Volume indicators reflect positive accumulation and buying pressure in the stock.
Conclusion:
Based on the analysis of technical indicators, the next few days' possible stock price movement for GAMR is likely to be bullish. The strong trend, momentum, and positive volume accumulation indicate a potential continuation of the upward trajectory. Traders and investors may consider buying opportunities in anticipation of further price appreciation. However, it is essential to monitor the volatility and set appropriate risk management strategies to navigate potential price fluctuations.