Technical Analysis of GAST 2024-05-10
Overview:
In analyzing the technical indicators for GAST over the last 5 days, we will delve into the trend, momentum, volatility, and volume indicators to provide a comprehensive outlook on the possible stock price movement in the coming days. By examining key metrics such as moving averages, MACD, RSI, Bollinger Bands, and OBV, we aim to offer valuable insights and recommendations for potential investors.
Trend Indicators:
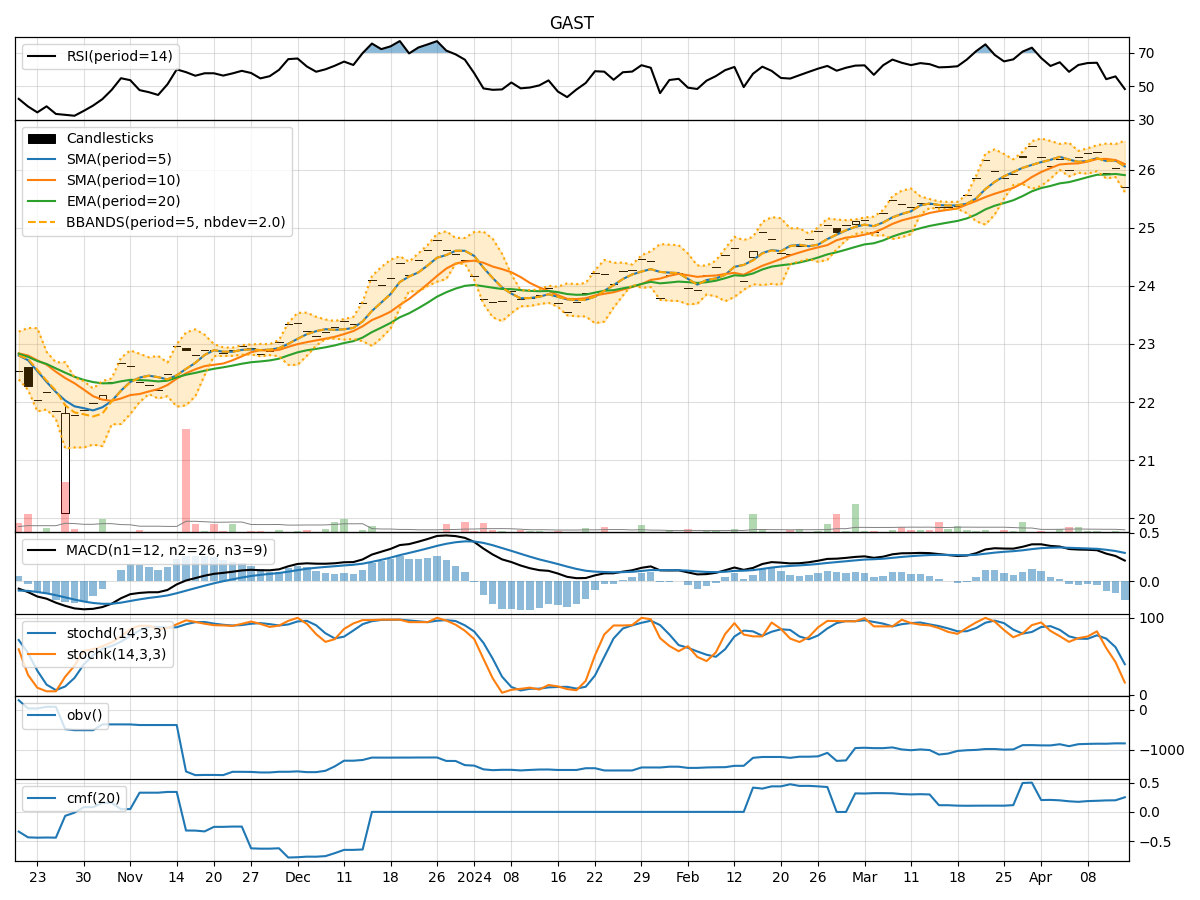
- Moving Averages (MA): The 5-day MA has been consistently above the closing prices, indicating a short-term uptrend.
- MACD: The MACD line has been trending upwards, with the MACD histogram showing positive values, suggesting bullish momentum.
- EMA: The EMA has been steadily increasing, reflecting a positive trend in the stock price.
Momentum Indicators:
- RSI: The RSI has been in the neutral to slightly overbought territory, indicating moderate buying pressure.
- Stochastic Oscillator: Both %K and %D have been rising, signaling increasing buying momentum.
- Williams %R: The indicator has been hovering in the oversold region, potentially indicating a buying opportunity.
Volatility Indicators:
- Bollinger Bands: The stock price has been trading within the bands, suggesting a period of consolidation.
- Bollinger %B: The %B indicator has been fluctuating around the midline, indicating a lack of clear trend direction.
Volume Indicators:
- On-Balance Volume (OBV): The OBV has shown a slight increase, suggesting some accumulation by investors.
- Chaikin Money Flow (CMF): The CMF has been negative, indicating selling pressure in the stock.
Key Observations:
- The trend indicators point towards a bullish sentiment, with moving averages and MACD showing positive signals.
- Momentum indicators suggest a mixed outlook, with RSI in a neutral zone and stochastic oscillators indicating buying momentum.
- Volatility indicators imply a period of consolidation, as the stock price remains within the Bollinger Bands.
- Volume indicators show a slight increase in buying interest but overall negative money flow.
Conclusion:
Based on the analysis of the technical indicators, the stock price of GAST is likely to experience further upward movement in the coming days. The bullish trend signals from moving averages and MACD, coupled with the positive momentum indicated by stochastic oscillators, support this view. However, the stock may face some resistance due to the neutral RSI and negative CMF. Overall, investors should consider buying opportunities in GAST, with a potential for higher prices in the short term.