Technical Analysis of GAUG 2024-05-10
Overview:
In analyzing the technical indicators for GAUG stock over the last 5 days, we will delve into the trends, momentum, volatility, and volume aspects to provide a comprehensive outlook on the possible stock price movement in the coming days. By examining key indicators such as moving averages, MACD, RSI, Bollinger Bands, and OBV, we aim to offer valuable insights and predictions for informed decision-making.
Trend Analysis:
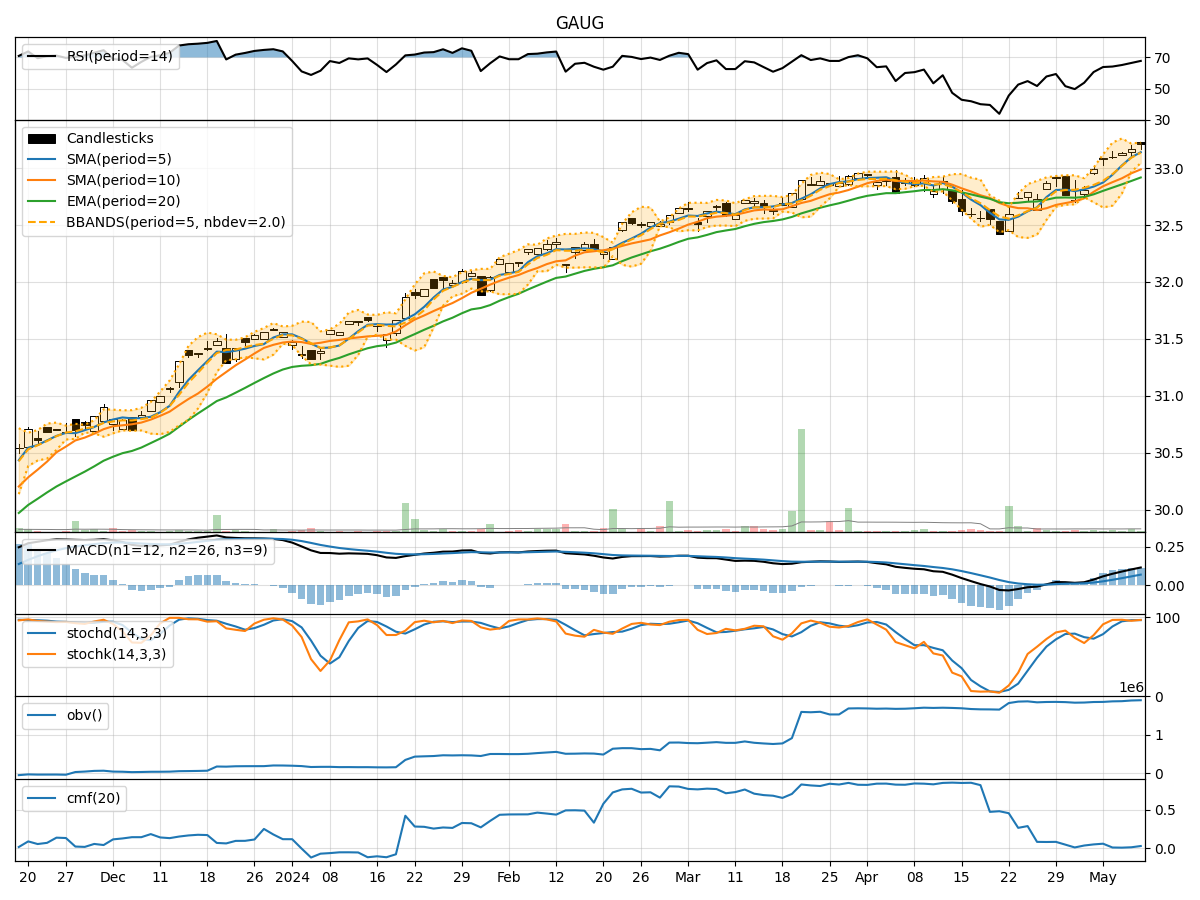
- Moving Averages (MA): The 5-day MA has been consistently above the closing prices, indicating an upward trend. This suggests a positive momentum in the stock price.
- MACD: The MACD line has been above the signal line for the past 5 days, with both lines showing an upward trajectory. This confirms the bullish sentiment in the stock.
Momentum Analysis:
- RSI: The RSI has been steadily increasing and is currently in the overbought territory above 70. This indicates a strong buying momentum in the stock.
- Stochastic Oscillator: Both %K and %D lines are in the overbought zone, suggesting a potential reversal or consolidation in the near future.
Volatility Analysis:
- Bollinger Bands (BB): The stock price has been trading within the upper Bollinger Band, indicating an overbought condition. This could lead to a potential pullback or consolidation.
Volume Analysis:
- On-Balance Volume (OBV): The OBV has been steadily increasing over the past 5 days, reflecting positive accumulation of the stock by investors.
Conclusion:
Based on the analysis of the technical indicators, the stock of GAUG is currently exhibiting strong bullish signals in terms of trend and momentum. However, the overbought conditions indicated by the RSI and Stochastic Oscillator, along with the upper Bollinger Band, suggest a potential short-term correction or consolidation in the stock price. Investors should be cautious of a possible pullback in the coming days.
Recommendation:
Considering the overall bullish trend but the overbought conditions, it is advisable to exercise caution and consider potential profit-taking strategies. Traders may look for opportunities to enter long positions on pullbacks or wait for a clearer signal of a reversal before initiating new positions. Monitoring the price action closely in the next few days will be crucial to navigate the market dynamics effectively.