Technical Analysis of GCAD 2024-05-10
Overview:
In analyzing the technical indicators for GCAD over the last 5 days, we will delve into the trend, momentum, volatility, and volume indicators to provide a comprehensive outlook on the possible stock price movement in the coming days. By examining these key indicators, we aim to offer valuable insights and predictions for potential investors.
Trend Indicators:
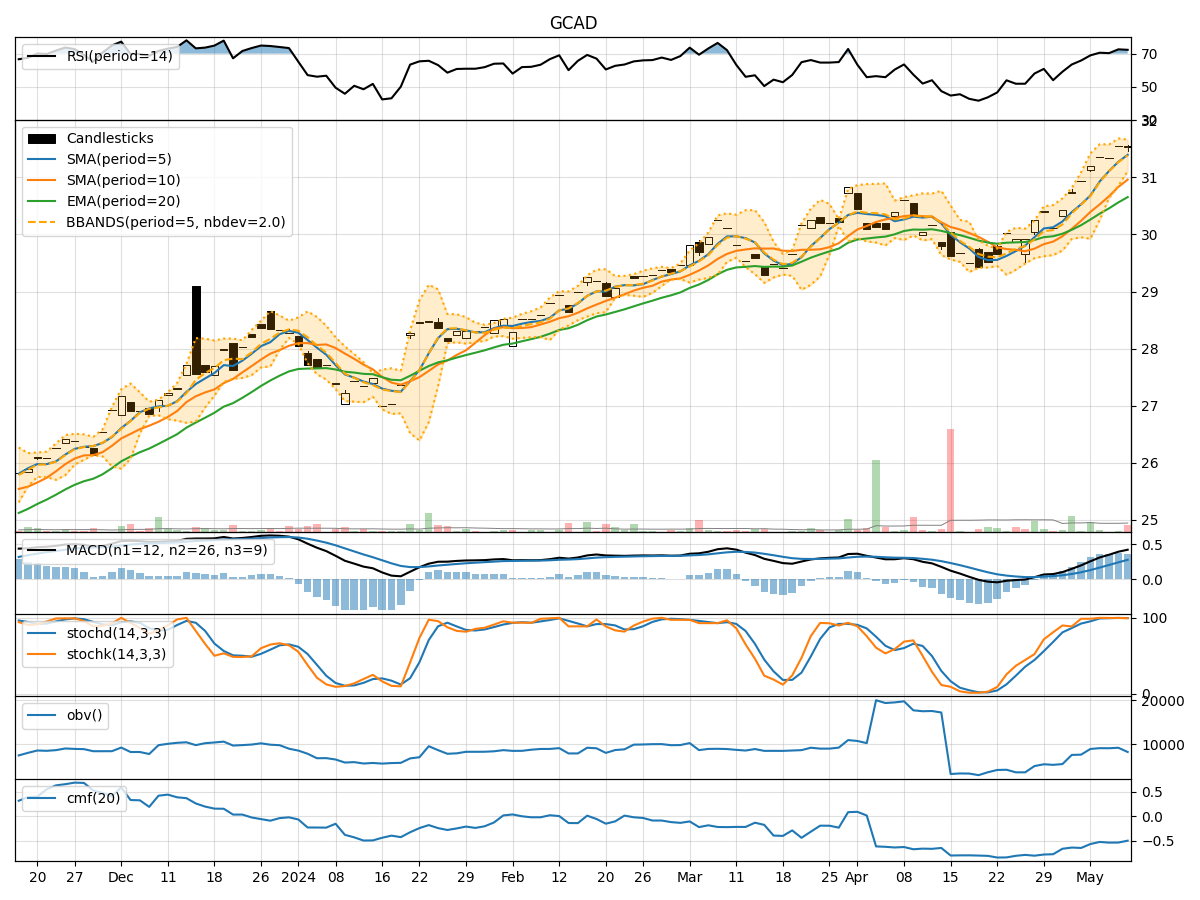
- Moving Averages (MA): The 5-day MA has been consistently above the 10-day SMA, indicating a short-term bullish trend. The EMA(20) has been steadily increasing, reflecting positive momentum.
- MACD: The MACD line has been above the signal line, suggesting bullish momentum in the stock price.
- Conclusion: The trend indicators point towards an upward movement in the stock price.
Momentum Indicators:
- RSI: The RSI has been in the overbought territory, indicating strong buying momentum.
- Stochastic Oscillator: Both %K and %D have been in the overbought zone, signaling a potential reversal.
- Williams %R: The indicator has been in the oversold region, suggesting a possible buying opportunity.
- Conclusion: The momentum indicators suggest a potential pullback or consolidation in the stock price.
Volatility Indicators:
- Bollinger Bands: The stock price has been trading within the bands, with the %B indicating a neutral position.
- Conclusion: Volatility remains relatively stable, indicating a sideways movement in the stock price.
Volume Indicators:
- On-Balance Volume (OBV): The OBV has shown mixed signals, with fluctuations in volume.
- Chaikin Money Flow (CMF): The CMF has been negative, indicating selling pressure.
- Conclusion: Volume indicators suggest a lack of strong buying interest in the stock.
Overall Conclusion:
Based on the analysis of the technical indicators, the stock price of GCAD is likely to experience a short-term upward movement due to the bullish trend indicators. However, the overbought conditions in the momentum indicators and the lack of strong buying volume signal a potential pullback or consolidation in the near future. The stable volatility indicates a sideways trend, further supporting the view of a potential consolidation phase.
Recommendation:
- Short-term Traders: Consider taking profits or setting tight stop-loss orders due to the overbought momentum indicators.
- Long-term Investors: Monitor the stock closely for a potential pullback to enter at more favorable levels.
- Risk Management: Exercise caution and consider diversifying your portfolio to mitigate potential risks associated with the current market conditions.
In conclusion, while the trend indicators suggest an upward movement, the overall market dynamics indicate a possible consolidation or pullback in the stock price of GCAD. It is essential to stay vigilant, adapt to changing market conditions, and make informed decisions based on a holistic analysis of both technical and fundamental factors.