Technical Analysis of GCLN 2024-05-10
Overview:
In analyzing the technical indicators for GCLN over the last 5 days, we will delve into the trend, momentum, volatility, and volume indicators to provide a comprehensive outlook on the possible stock price movement in the coming days. By examining these key indicators, we aim to offer valuable insights and recommendations for potential investors.
Trend Indicators:
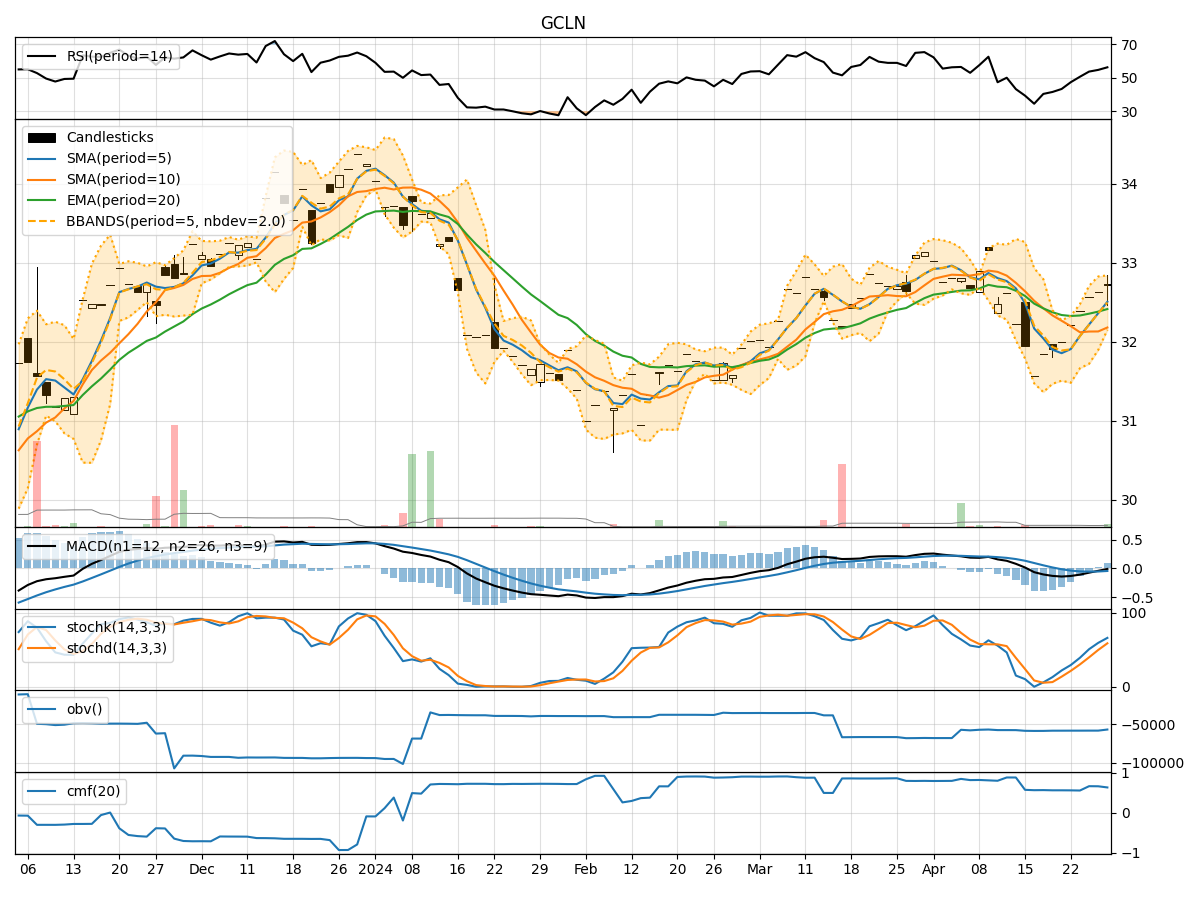
- Moving Averages (MA): The moving averages have been showing an upward trend, with the 5-day MA consistently above the longer-term SMAs and EMAs. This indicates a positive momentum in the stock price.
- MACD: The MACD line has been consistently above the signal line, suggesting bullish momentum in the stock.
- MACD Histogram: The MACD histogram has been increasing, indicating strengthening bullish momentum.
Momentum Indicators:
- RSI: The RSI has been in the overbought territory, indicating a strong bullish momentum in the stock.
- Stochastic Oscillator: Both %K and %D have been in the overbought zone, suggesting a potential reversal or consolidation in the stock price.
- Williams %R: The Williams %R has been consistently in the oversold territory, indicating a strong bullish sentiment.
Volatility Indicators:
- Bollinger Bands: The Bollinger Bands have been narrowing, indicating decreasing volatility in the stock price.
- Bollinger %B: The %B indicator has been hovering around 0.8, suggesting the stock is trading near the upper band.
- Average True Range (ATR): The ATR has been relatively stable, indicating consistent price movements.
Volume Indicators:
- On-Balance Volume (OBV): The OBV has been slightly decreasing, suggesting some distribution in the stock.
- Chaikin Money Flow (CMF): The CMF has been positive, indicating buying pressure in the stock.
Key Observations:
- The trend indicators suggest a strong bullish momentum in the stock, supported by moving averages and MACD.
- Momentum indicators indicate an overbought condition, which might lead to a potential reversal or consolidation.
- Volatility indicators show decreasing volatility, which could lead to a period of consolidation or a breakout.
- Volume indicators suggest some distribution in the stock, which might impact the price movement.
Conclusion:
Based on the analysis of the technical indicators, the next few days' possible stock price movement for GCLN is likely to experience a consolidation phase. The stock has shown strong bullish momentum but is currently in an overbought condition, indicating a potential reversal or sideways movement. Traders should be cautious of a possible pullback or a period of range-bound trading. It is advisable to wait for clearer signals or confirmation from the indicators before making any significant trading decisions.