Technical Analysis of GDIV 2024-05-10
Overview:
In analyzing the technical indicators for GDIV over the last 5 days, we will delve into the trend, momentum, volatility, and volume indicators to provide a comprehensive outlook on the possible stock price movement in the coming days. By examining these key indicators, we aim to offer valuable insights and predictions for potential investors.
Trend Analysis:
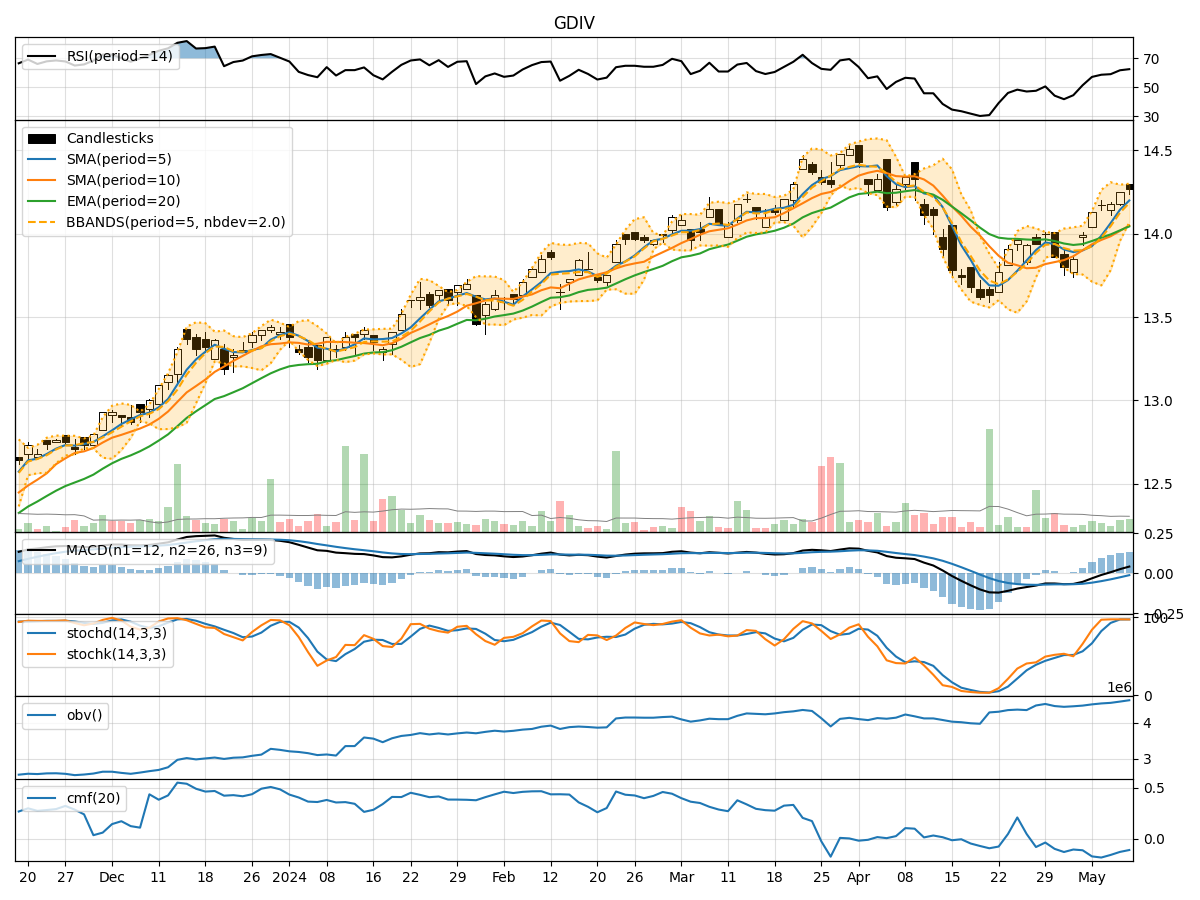
- Moving Averages (MA): The 5-day Moving Average (MA) has been consistently above the Simple Moving Average (SMA) and Exponential Moving Average (EMA), indicating a bullish trend.
- MACD: The MACD line has been consistently above the signal line, with both lines trending upwards, suggesting a bullish momentum.
Key Observation: The trend indicators point towards a bullish sentiment in the stock price movement.
Momentum Analysis:
- RSI: The Relative Strength Index (RSI) has been increasing steadily and is currently in the overbought territory, indicating strong buying momentum.
- Stochastic Oscillator: Both %K and %D lines of the Stochastic Oscillator are in the overbought zone, suggesting a potential reversal.
Key Observation: The momentum indicators signal a mixed sentiment with a possibility of a reversal due to overbought conditions.
Volatility Analysis:
- Bollinger Bands (BB): The stock price has been trading within the upper Bollinger Band, indicating increased volatility.
Key Observation: The volatility indicators suggest increased volatility in the stock price movement.
Volume Analysis:
- On-Balance Volume (OBV): The OBV has been increasing over the last 5 days, indicating accumulation by investors.
- Chaikin Money Flow (CMF): The CMF has been negative, suggesting selling pressure in the stock.
Key Observation: The volume indicators show a mixed sentiment with accumulation in OBV but selling pressure in CMF.
Conclusion:
Based on the analysis of the technical indicators, the stock of GDIV is likely to experience upward movement in the coming days, supported by the bullish trend and momentum indicators. However, the overbought conditions in the momentum indicators and increased volatility signal a potential reversal or consolidation in the short term. Investors should closely monitor the price action and consider taking profits or implementing risk management strategies in case of a reversal.