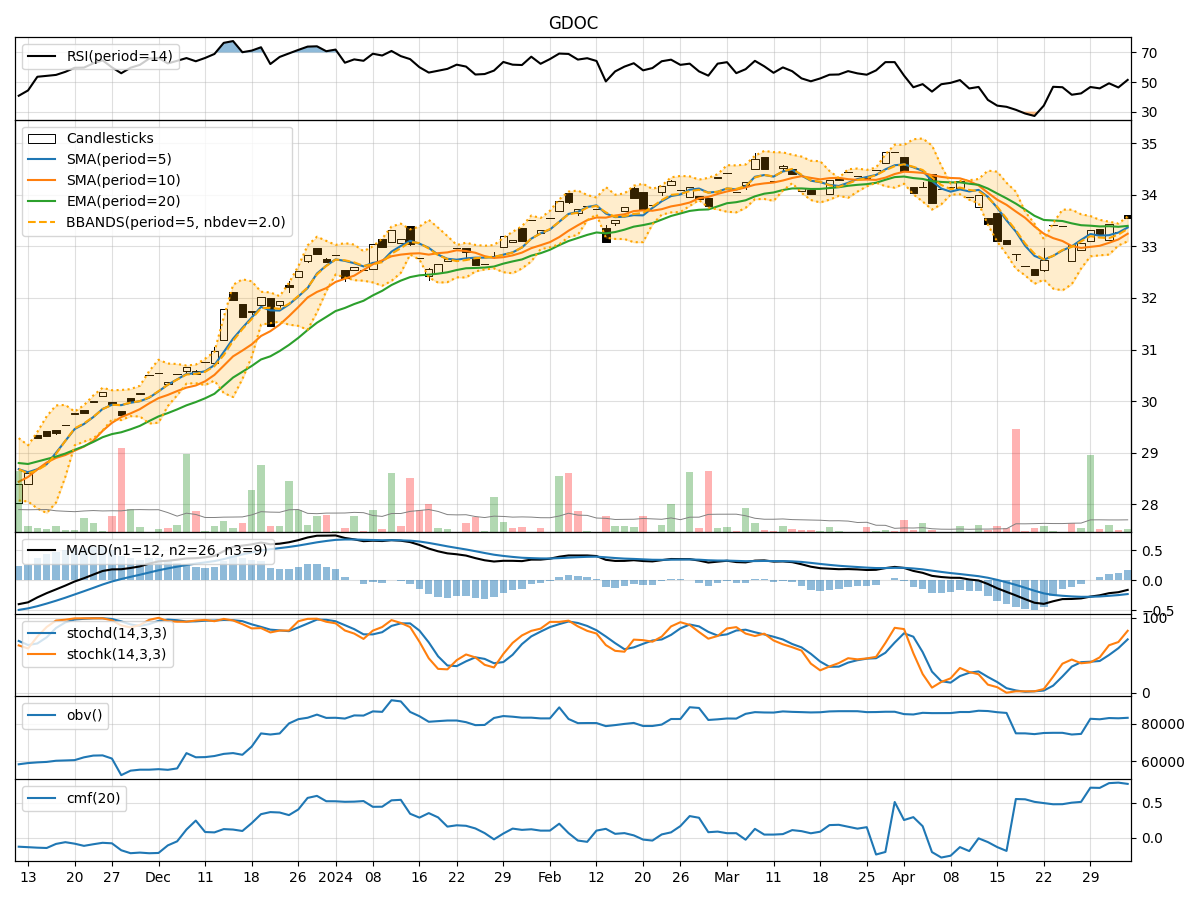
Technical Analysis of GDOC 2024-05-10
Overview:
In analyzing the technical indicators for GDOC over the last 5 days, we will delve into the trend, momentum, volatility, and volume indicators to provide a comprehensive outlook on the possible stock price movement in the coming days.
Trend Analysis:
- Moving Averages (MA): The 5-day Moving Average (MA) has been consistently above the Simple Moving Average (SMA) and Exponential Moving Average (EMA), indicating a short-term uptrend.
- MACD: The MACD line has been positive, with the MACD Histogram showing an increasing trend, suggesting bullish momentum.
Momentum Analysis:
- RSI: The Relative Strength Index (RSI) has been fluctuating around the mid-level, indicating a neutral momentum.
- Stochastic Oscillator: Both %K and %D have been in the overbought zone, suggesting a potential reversal or consolidation.
Volatility Analysis:
- Bollinger Bands (BB): The stock price has been trading within the Bollinger Bands, with the bands narrowing, indicating decreasing volatility.
Volume Analysis:
- On-Balance Volume (OBV): The OBV has shown mixed movements, indicating indecision among investors.
- Chaikin Money Flow (CMF): The CMF has been positive, suggesting buying pressure in the market.
Key Observations:
- The trend indicators point towards a short-term uptrend in the stock price.
- Momentum indicators show a neutral stance with a potential for a reversal in the overbought zone.
- Volatility has been decreasing, indicating a possible period of consolidation.
- Volume indicators reflect mixed sentiments among investors.
Conclusion:
Based on the analysis of the technical indicators, the next few days' possible stock price movement for GDOC is likely to be sideways with a slight upward bias. The stock may experience a period of consolidation as volatility decreases, while the momentum indicators suggest a potential reversal or a period of indecision among investors. Traders should closely monitor key support and resistance levels for potential breakout opportunities.
Recommendation:
- Short-term Traders: Consider range-bound trading strategies with tight stop-loss levels.
- Long-term Investors: Monitor for a clear trend confirmation before making significant investment decisions.
By combining insights from trend, momentum, volatility, and volume indicators, investors can make informed decisions aligned with the current market dynamics.