Technical Analysis of GDVD 2024-05-10
Overview:
In analyzing the technical indicators for GDVD stock over the last 5 days, we will delve into the trend, momentum, volatility, and volume indicators to provide a comprehensive outlook on the possible stock price movement in the coming days. By examining these key indicators, we aim to offer valuable insights and predictions for potential investors.
Trend Indicators:
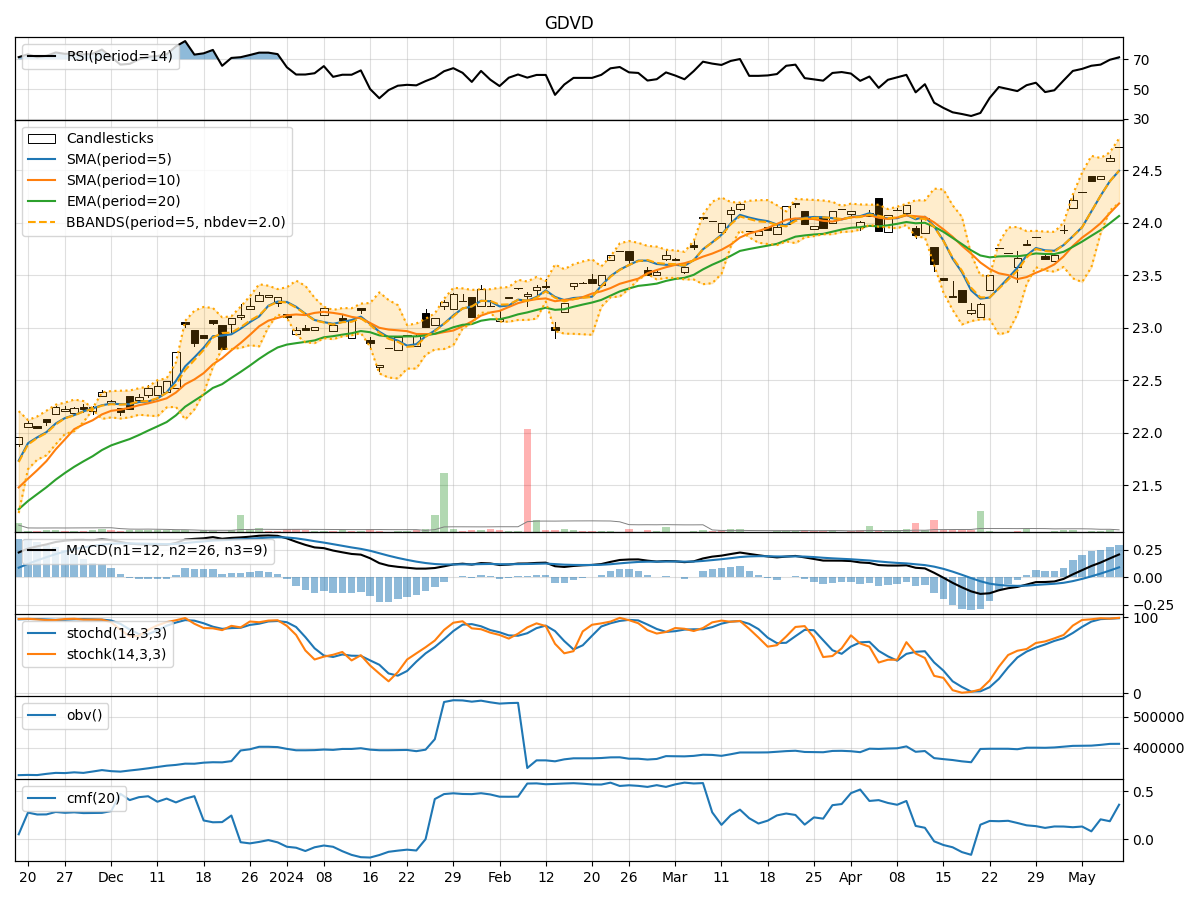
- Moving Averages (MA): The moving averages have been showing an upward trend, with the 5-day MA consistently above the longer-term SMAs and EMAs. This indicates a positive momentum in the stock price.
- MACD: The MACD line has been consistently above the signal line, with both lines showing an increasing trend. This suggests a bullish momentum in the stock.
- RSI: The RSI has been trending upwards and is currently in the overbought territory, indicating a strong bullish sentiment in the stock.
Momentum Indicators:
- Stochastic Oscillator: The stochastic oscillator is in the overbought zone, suggesting that the stock may be overvalued in the short term.
- Williams %R: The Williams %R is also in the overbought region, indicating a potential reversal or correction in the stock price.
Volatility Indicators:
- Bollinger Bands: The Bollinger Bands have been widening, indicating increased volatility in the stock price. The stock has been trading near the upper band, suggesting a potential overbought condition.
- Average True Range (ATR): The ATR has been increasing, reflecting higher volatility in the stock.
Volume Indicators:
- On-Balance Volume (OBV): The OBV has been trending upwards, indicating that buying volume has been higher than selling volume.
- Chaikin Money Flow (CMF): The CMF is positive, suggesting that money is flowing into the stock.
Key Observations:
- The trend indicators, momentum indicators, and volume indicators all point towards a bullish sentiment in the stock.
- However, the overbought conditions indicated by the stochastic oscillator and Williams %R, along with the widening Bollinger Bands, suggest a potential reversal or correction in the stock price.
- The increasing ATR signifies higher volatility, which could lead to sharp price movements in the coming days.
Conclusion:
Based on the analysis of the technical indicators, the stock price of GDVD is likely to experience a short-term correction or consolidation due to the overbought conditions and increased volatility. Investors should exercise caution and consider waiting for a better entry point before initiating new positions. It is advisable to closely monitor the price action and key support levels for potential buying opportunities in the future.