Technical Analysis of GDXD 2024-05-10
Overview:
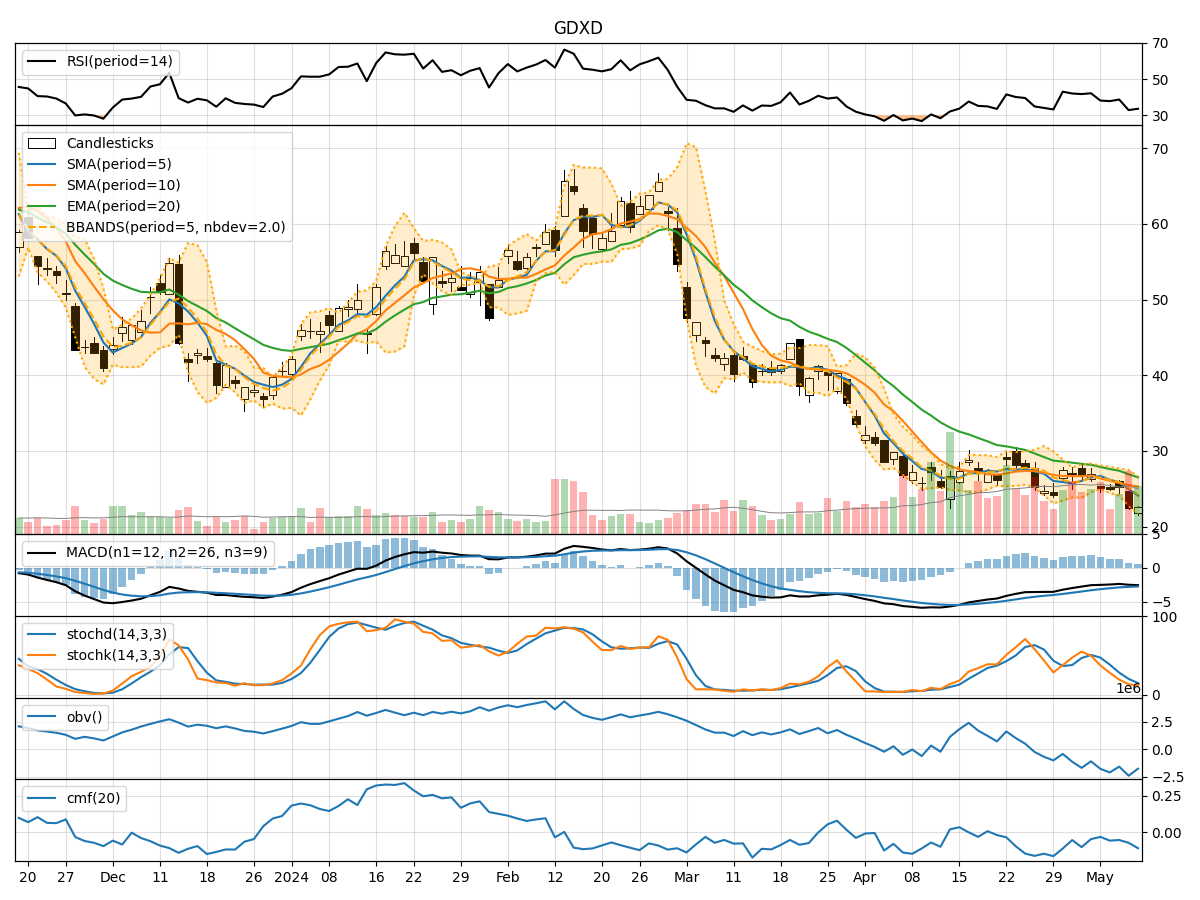
In analyzing the technical indicators for GDXD over the last 5 days, we will delve into the trend, momentum, volatility, and volume indicators to provide a comprehensive outlook on the possible stock price movement. By examining these key aspects, we aim to offer valuable insights and predictions for the upcoming days.
Trend Indicators:
- Moving Averages (MA): The 5-day MA has been consistently below the closing prices, indicating a downward trend.
- MACD: The MACD line has been below the signal line, suggesting bearish momentum.
- EMA: The exponential moving average has also been trending downwards, reflecting a negative sentiment in the market.
Momentum Indicators:
- RSI: The Relative Strength Index has been hovering around the oversold territory, indicating a potential reversal or continuation of the downtrend.
- Stochastic Oscillator: Both %K and %D have been in the oversold region, signaling a possible reversal in the near future.
- Williams %R: The indicator has been in the oversold zone, suggesting a potential buying opportunity.
Volatility Indicators:
- Bollinger Bands: The stock price has been consistently trading below the lower Bollinger Band, indicating oversold conditions.
- Bollinger %B: The %B indicator has been below 0.2, suggesting a potential bounce back in prices.
- Average True Range (ATR): The ATR has shown a decrease in volatility, which could lead to a period of consolidation.
Volume Indicators:
- On-Balance Volume (OBV): The OBV has been declining, indicating selling pressure in the market.
- Chaikin Money Flow (CMF): The CMF has been negative, reflecting a lack of buying interest in the stock.
Key Observations:
- The trend indicators, momentum indicators, and volume indicators all point towards a bearish sentiment in the market.
- The volatility indicators suggest that the stock may be oversold and due for a potential reversal.
- The momentum indicators show signs of a possible turnaround in the near future.
Conclusion:
Based on the analysis of the technical indicators, the next few days for GDXD are likely to see further downward movement in the stock price. However, given the oversold conditions and potential reversal signals from the momentum indicators, there could be a short-term bounce back before resuming the downtrend. Traders should exercise caution and consider waiting for confirmation signals before making any trading decisions.