Technical Analysis of GEM 2024-05-10
Overview:
In analyzing the technical indicators for GEM stock over the last 5 days, we will delve into the trends, momentum, volatility, and volume indicators to provide a comprehensive outlook on the possible stock price movement in the coming days. By examining key metrics such as moving averages, MACD, RSI, Bollinger Bands, and OBV, we aim to offer valuable insights and predictions for informed decision-making.
Trend Indicators Analysis:
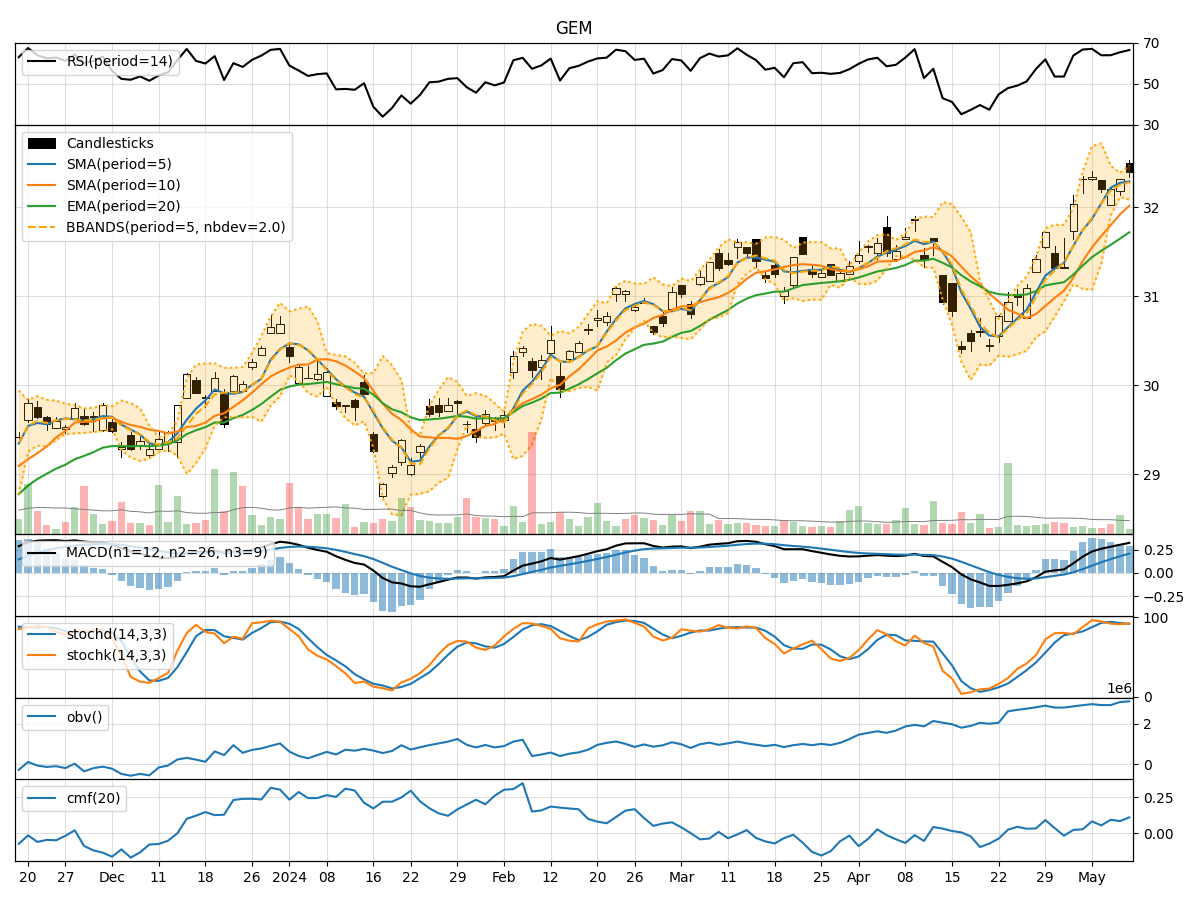
- Moving Averages (MA): The 5-day MA has been consistently above the closing prices, indicating a bullish trend.
- MACD: The MACD line has been steadily increasing, with the MACD histogram showing positive values, suggesting upward momentum.
Momentum Indicators Analysis:
- RSI: The RSI values have been in the overbought territory, indicating a strong bullish momentum.
- Stochastic Oscillator: Both %K and %D values have been relatively high, signaling strong buying pressure.
Volatility Indicators Analysis:
- Bollinger Bands: The stock price has been trading within the upper Bollinger Band, suggesting an overbought condition.
Volume Indicators Analysis:
- On-Balance Volume (OBV): The OBV has been increasing, reflecting accumulation by investors.
Key Observations and Opinions:
- Trend: The stock is in a strong upward trend supported by moving averages and MACD.
- Momentum: The momentum indicators like RSI and Stochastic Oscillator indicate a strong bullish sentiment in the market.
- Volatility: The stock is currently in an overbought condition as per Bollinger Bands.
- Volume: The increasing OBV suggests positive accumulation by investors.
Conclusion:
Based on the analysis of the technical indicators, the next few days are likely to see the stock price continuing its upward movement. The strong bullish trend, supported by momentum and volume indicators, indicates a favorable outlook for GEM stock. Traders and investors may consider buying opportunities in the short term, keeping a close watch on the overbought conditions highlighted by the volatility indicators. Overall, the technical analysis points towards a bullish bias for GEM stock in the upcoming trading sessions.