Technical Analysis of GERM 2024-05-10
Overview:
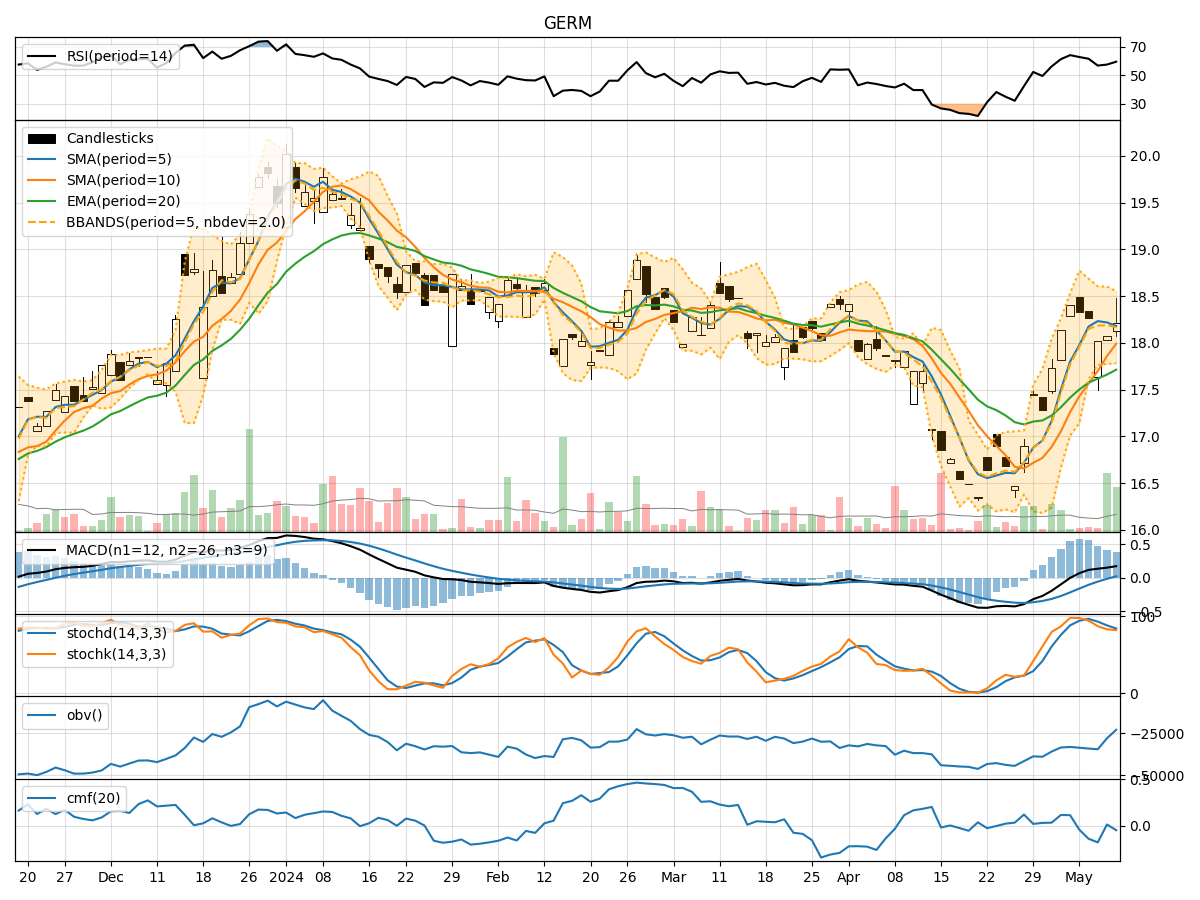
In analyzing the technical indicators for GERM over the last 5 days, we will delve into the trend, momentum, volatility, and volume indicators to provide a comprehensive outlook on the possible stock price movement in the coming days.
Trend Analysis:
- Moving Averages (MA): The 5-day Moving Average (MA) has been consistently above the Simple Moving Average (SMA) and Exponential Moving Average (EMA), indicating a bullish trend.
- MACD: The MACD line has been consistently above the signal line, with the MACD Histogram showing an increasing positive trend, further supporting the bullish sentiment.
Momentum Analysis:
- RSI: The Relative Strength Index (RSI) has been fluctuating around the 50 level, indicating a neutral momentum in the stock.
- Stochastic Oscillator: Both %K and %D have been trending downwards, suggesting a potential weakening of momentum.
Volatility Analysis:
- Bollinger Bands (BB): The stock price has been trading within the Bollinger Bands, with the bands narrowing, indicating decreasing volatility.
- Bollinger %B: The %B indicator has been hovering around the midline, reflecting a neutral stance in terms of volatility.
Volume Analysis:
- On-Balance Volume (OBV): The OBV has shown mixed signals, with fluctuations in volume accumulation.
- Chaikin Money Flow (CMF): The CMF has been negative, indicating a bearish pressure on the stock.
Key Observations:
- The trend indicators suggest a bullish sentiment in the stock, supported by the MACD analysis.
- Momentum indicators show a neutral to slightly bearish momentum, as indicated by the RSI and Stochastic Oscillator.
- Volatility indicators point towards decreasing volatility in the stock.
- Volume indicators reflect mixed signals, with OBV showing fluctuations and CMF indicating bearish pressure.
Conclusion:
Based on the analysis of the technical indicators, the stock price of GERM is likely to experience sideways movement in the coming days. The bullish trend indicated by the moving averages and MACD may be offset by the neutral to bearish momentum and bearish pressure highlighted by the volume indicators. Additionally, the decreasing volatility suggests a period of consolidation. Therefore, investors should exercise caution and closely monitor the stock for any potential shifts in market dynamics.