Technical Analysis of GFEB 2024-05-10
Overview:
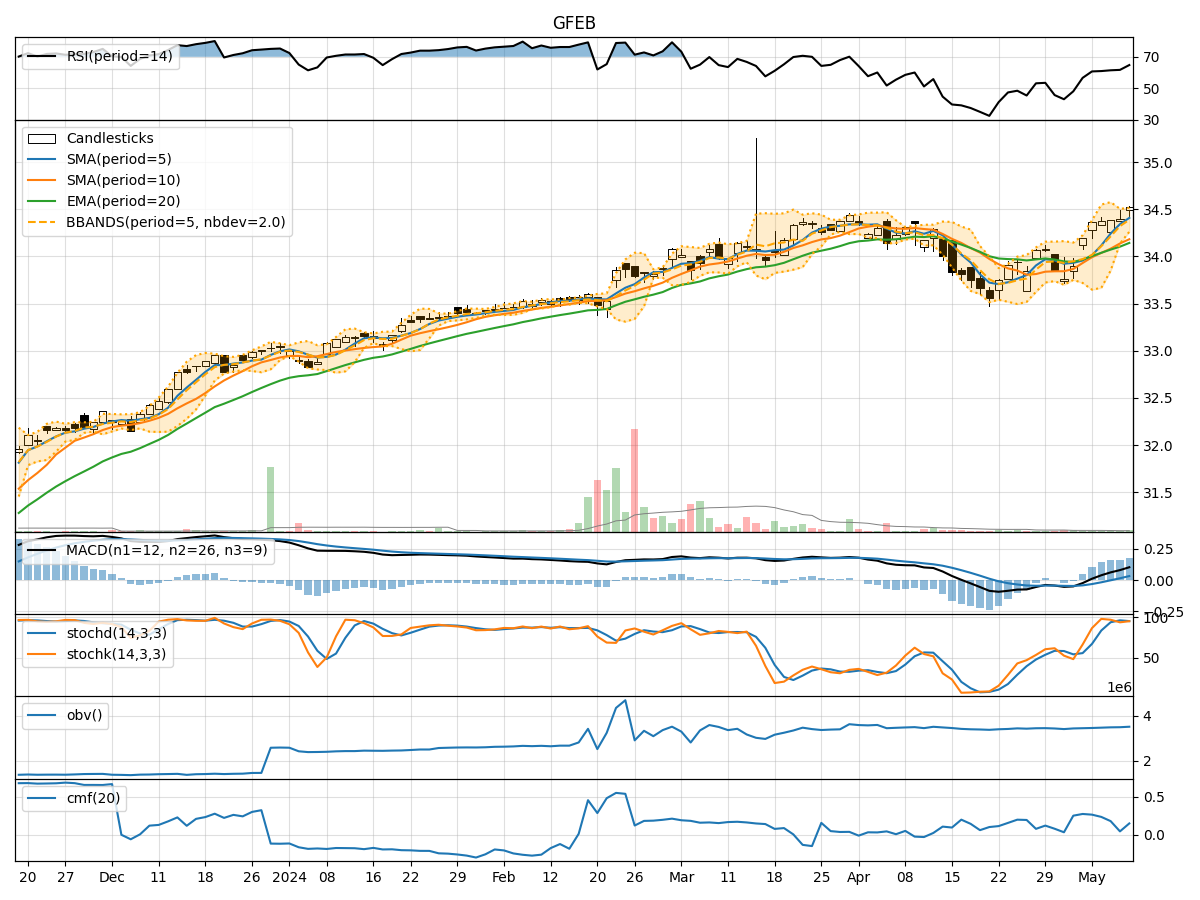
In analyzing the technical indicators for GFEB stock over the last 5 days, we will delve into the trends, momentum, volatility, and volume aspects to provide insights into the possible future stock price movements. By examining key indicators such as moving averages, MACD, RSI, Bollinger Bands, and OBV, we aim to offer a comprehensive analysis and make informed predictions.
Trend Analysis:
- Moving Averages (MA): The 5-day moving average has been consistently rising, indicating a bullish trend in the short term.
- MACD: The MACD line has been above the signal line, suggesting positive momentum in the stock price.
Momentum Analysis:
- RSI: The RSI has been increasing, reaching the overbought territory, signaling potential strength in the stock's momentum.
- Stochastic Oscillator: Both %K and %D have been relatively high, indicating bullish momentum.
Volatility Analysis:
- Bollinger Bands: The stock price has been trading within the bands, with the bands narrowing, suggesting a potential decrease in volatility.
Volume Analysis:
- On-Balance Volume (OBV): The OBV has been steadily increasing, indicating accumulation by investors.
Key Observations:
- The stock is in an upward trend based on moving averages and MACD.
- Momentum indicators like RSI and Stochastic Oscillator suggest bullish momentum.
- Volatility is decreasing based on Bollinger Bands.
- Volume is increasing, indicating buying pressure.
Conclusion:
Based on the analysis of technical indicators, the next few days for GFEB stock are likely to see further upward movement. The bullish trend, positive momentum, decreasing volatility, and increasing volume all point towards a continuation of the current uptrend. Traders and investors may consider buying opportunities in GFEB stock for potential gains in the near term.