Technical Analysis of GFGF 2024-05-10
Overview:
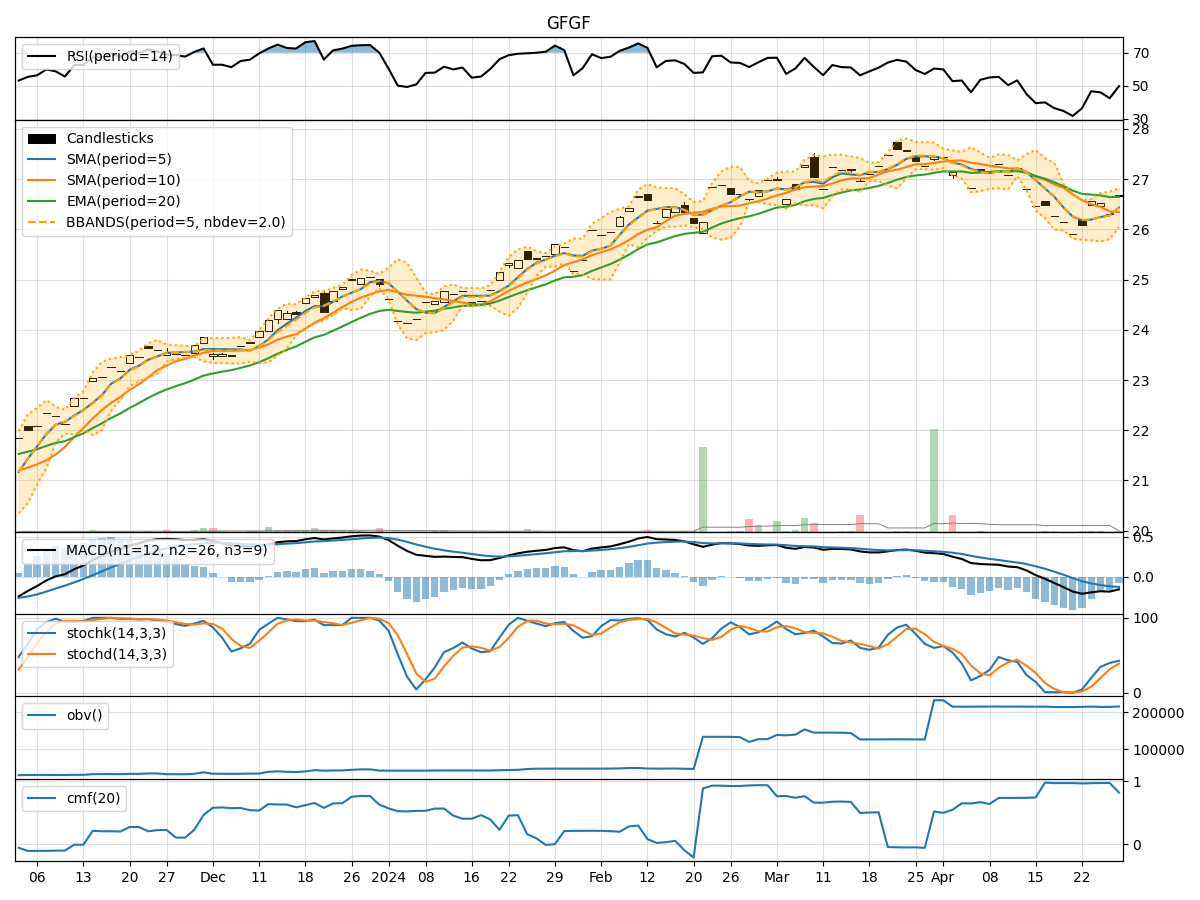
In the last 5 trading days, GFGF stock has shown a consistent upward trend in its closing price, accompanied by increasing volumes. The moving averages (MA), MACD, and momentum indicators all suggest a bullish sentiment. However, the stock is currently in overbought territory based on the RSI and stochastic indicators. Volatility has been relatively stable, and the volume indicators show a slight decline in buying pressure.
Trend Analysis:
- Moving Averages (MA): The 5-day MA has been consistently above the 10-day SMA, indicating a short-term bullish trend. The EMA(20) is also trending upwards, supporting the bullish sentiment.
- MACD: The MACD line has been consistently above the signal line, with both lines showing an upward trajectory. The MACD histogram is also in positive territory, suggesting bullish momentum.
Momentum Analysis:
- RSI: The RSI has been increasing and is currently in the overbought zone, indicating a potential reversal or consolidation in the near future.
- Stochastic Oscillator: Both %K and %D lines are in the overbought region, signaling a potential pullback or consolidation.
Volatility Analysis:
- Bollinger Bands (BB): The stock price has been trading within the upper Bollinger Band, indicating an overbought condition. The bands are relatively narrow, suggesting low volatility.
Volume Analysis:
- On-Balance Volume (OBV): The OBV has been relatively flat, indicating a balance between buying and selling pressure. This could suggest a potential lack of conviction in the current uptrend.
- Chaikin Money Flow (CMF): The CMF is negative, indicating a slight outflow of money from the stock.
Key Observations:
- The technical indicators suggest a strong bullish trend in the short term, supported by moving averages and MACD.
- However, the overbought conditions indicated by RSI and stochastic oscillators raise concerns about a potential reversal or consolidation.
- Volatility is relatively low, indicating a lack of significant price fluctuations.
- The volume indicators show a slight decline in buying pressure, which could impact the sustainability of the current uptrend.
Conclusion:
Based on the analysis of the technical indicators, the next few days for GFGF stock could see a potential consolidation or pullback. The overbought conditions and lack of significant buying pressure suggest a possible pause in the current uptrend. Traders should exercise caution and consider taking profits or implementing risk management strategies. A short-term downward correction or sideways movement is likely before a potential resumption of the bullish trend.