Technical Analysis of GFOF 2024-05-10
Overview:
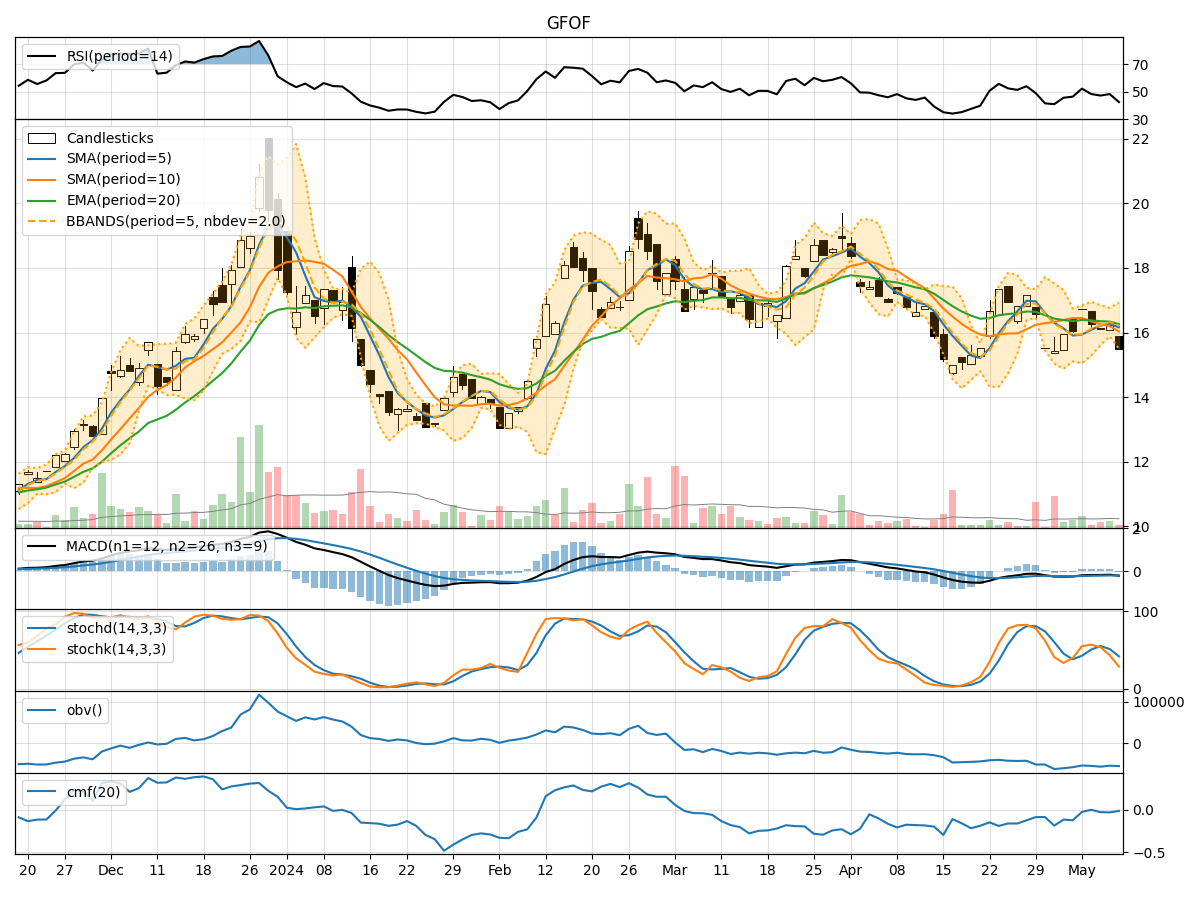
In the last 5 trading days, GFOF stock has shown mixed signals across various technical indicators. The stock price has been fluctuating within a certain range, indicating indecision in the market. By analyzing trend, momentum, volatility, and volume indicators, we can gain insights into the potential future price movement of GFOF stock.
Trend Indicators:
- Moving Averages (MA): The 5-day MA has been fluctuating around the 10-day SMA and 20-day EMA, indicating a lack of clear trend direction.
- Moving Average Convergence Divergence (MACD): The MACD line has been consistently below the signal line, suggesting a bearish momentum.
- Conclusion: Bearish trend signals are prevalent, indicating a potential downward movement in the stock price.
Momentum Indicators:
- Relative Strength Index (RSI): RSI values have been fluctuating around the 50 level, indicating a lack of strong momentum in either direction.
- Stochastic Oscillator: Both %K and %D values have been fluctuating, showing indecision in momentum.
- Conclusion: Neutral momentum signals suggest a lack of clear direction in the short term.
Volatility Indicators:
- Bollinger Bands (BB): The stock price has been trading within the bands, indicating a period of consolidation.
- Conclusion: Sideways movement is likely to continue as volatility remains relatively stable.
Volume Indicators:
- On-Balance Volume (OBV): The OBV values have been fluctuating, indicating mixed buying and selling pressure.
- Chaikin Money Flow (CMF): The CMF has been negative, suggesting a lack of strong buying interest.
- Conclusion: Neutral volume signals imply a balanced market sentiment with no clear dominance.
Overall Conclusion:
Based on the analysis of trend, momentum, volatility, and volume indicators, the next few days for GFOF stock are likely to see sideways consolidation with a slight bearish bias. The lack of strong trend, mixed momentum, stable volatility, and neutral volume signals indicate a period of indecision and potential range-bound trading.
Recommendation:
- Traders may consider implementing range-bound strategies to capitalize on the sideways movement.
- Investors should exercise caution and wait for clearer trend signals before making significant trading decisions.
- Monitoring key support and resistance levels can help in identifying potential breakout or breakdown scenarios.
In conclusion, while the technical indicators suggest a lack of clear direction, a cautious approach with a focus on risk management is advisable in the current market environment.