Technical Analysis of GGLS 2024-05-10
Overview:
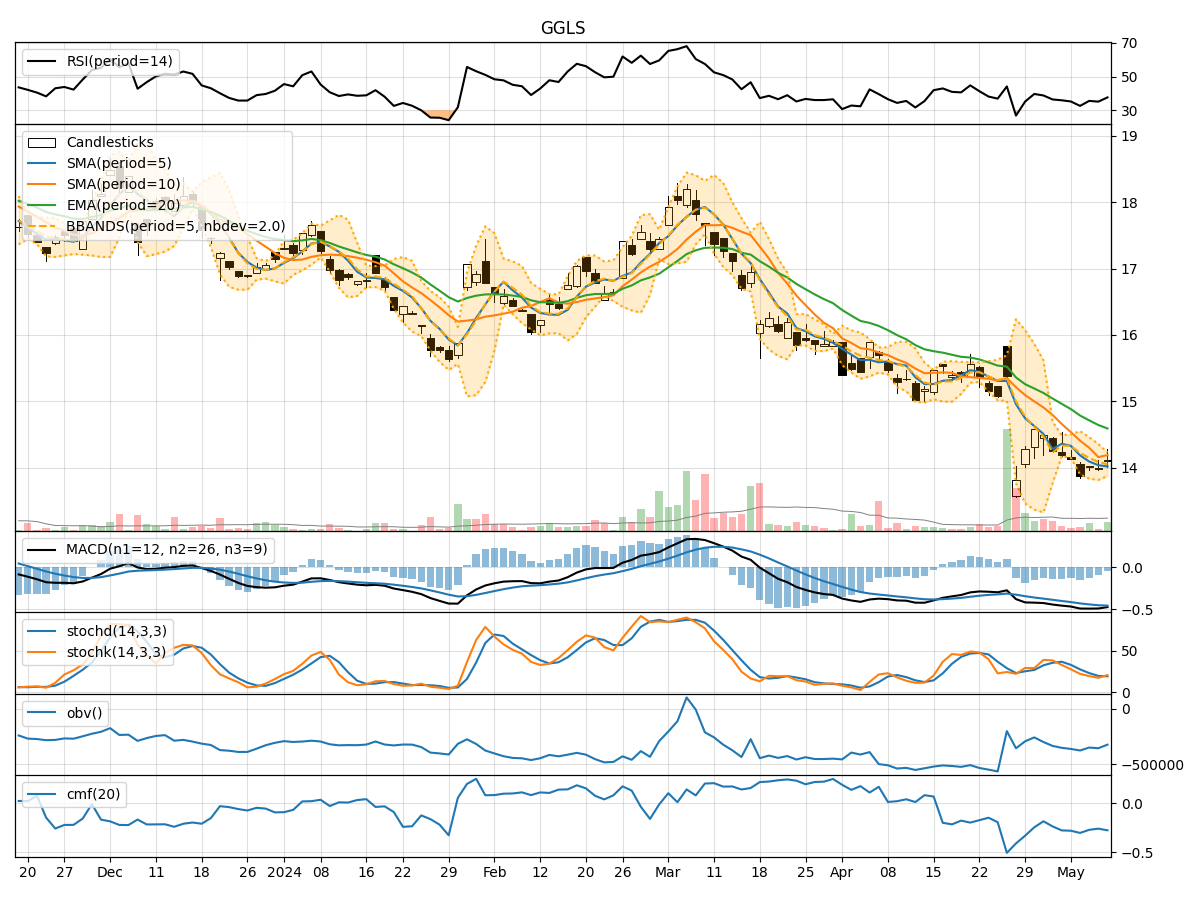
In analyzing the technical indicators for GGLS over the last 5 days, we will delve into the trend, momentum, volatility, and volume indicators to provide a comprehensive assessment of the stock's potential price movement. By examining these key factors, we aim to offer valuable insights and predictions for the next few days.
Trend Analysis:
- Moving Averages (MA): The 5-day MA has been consistently below the closing prices, indicating a short-term downtrend.
- MACD: The MACD line has been below the signal line, suggesting bearish momentum.
- EMA: The EMA has been trending downwards, reflecting a weakening trend.
Key Observation: The trend indicators point towards a bearish sentiment in the short term.
Momentum Analysis:
- RSI: The RSI values have been relatively low, indicating oversold conditions.
- Stochastic Oscillator: Both %K and %D have been in the oversold territory, signaling a potential reversal.
- Williams %R: The indicator has been consistently in the oversold region, suggesting a possible bounce back.
Key Observation: Momentum indicators suggest a potential reversal in the near future.
Volatility Analysis:
- Bollinger Bands (BB): The stock price has been trading close to the lower Bollinger Band, indicating low volatility.
- Bollinger %B: The %B value is below 1, suggesting the stock is trading near the lower band.
- Average True Range (ATR): ATR values have been relatively low, indicating decreased volatility.
Key Observation: Volatility indicators point towards a consolidation phase with limited price movements.
Volume Analysis:
- On-Balance Volume (OBV): The OBV has been fluctuating, indicating indecision among investors.
- Chaikin Money Flow (CMF): The CMF values have been negative, suggesting outflow of money from the stock.
Key Observation: Volume indicators reflect mixed sentiment among market participants.
Conclusion:
Based on the analysis of trend, momentum, volatility, and volume indicators, the next few days for GGLS are likely to see a sideways movement with a potential for a bullish reversal in momentum. The stock is currently in a consolidation phase with limited volatility, but the oversold conditions in momentum indicators hint at a possible uptick in prices.
Recommendation: Considering the technical indicators and the potential for a bullish reversal in momentum, investors may consider monitoring the stock closely for signs of a confirmed uptrend before considering entry positions. It is advisable to wait for confirmation signals from both price action and momentum indicators before making any trading decisions.