Technical Analysis of GGM 2024-05-10
Overview:
In analyzing the technical indicators for the last 5 days of GGM stock, we will delve into the trend, momentum, volatility, and volume indicators to provide a comprehensive outlook on the possible stock price movement in the coming days. By examining these key indicators, we aim to offer valuable insights and recommendations for potential investors.
Trend Indicators:
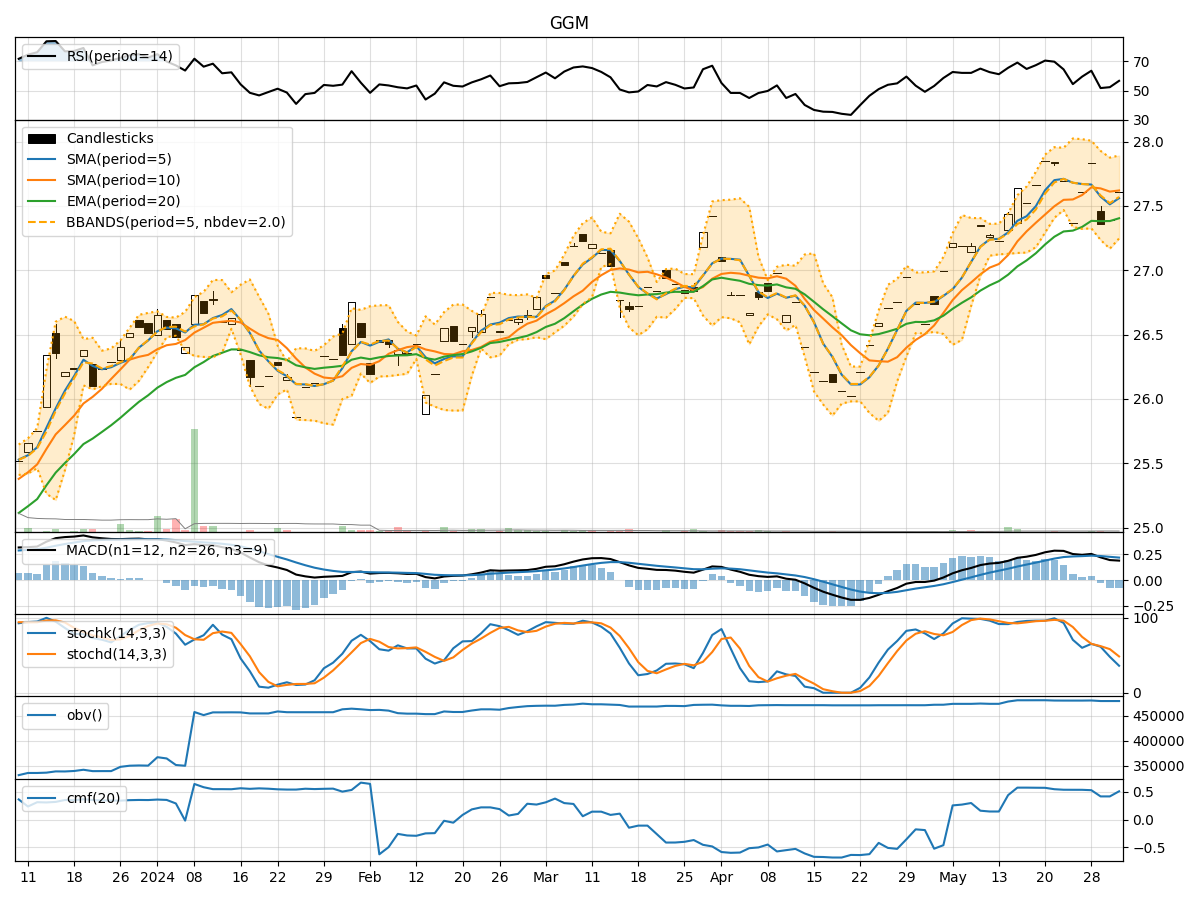
- Moving Averages (MA): The moving averages have been showing an upward trend, with the 5-day MA consistently above the longer-term SMAs and EMAs. This indicates a positive momentum in the stock price.
- MACD: The MACD line has been consistently above the signal line, suggesting bullish momentum in the stock.
- MACD Histogram: The MACD histogram has been increasing, indicating strengthening bullish momentum.
Momentum Indicators:
- RSI: The RSI has been fluctuating around the overbought territory, indicating strong buying pressure in the stock.
- Stochastic Oscillator: Both %K and %D lines of the stochastic oscillator have been in the overbought zone, suggesting a potential reversal or consolidation in the stock price.
- Williams %R: The Williams %R has been in the oversold territory, indicating a possible buying opportunity.
Volatility Indicators:
- Bollinger Bands: The Bollinger Bands have been narrowing, indicating decreasing volatility in the stock price.
- Bollinger %B: The %B indicator has been hovering around 0.5, suggesting the stock is trading at the middle of the bands.
Volume Indicators:
- On-Balance Volume (OBV): The OBV has been relatively stable, indicating consistent buying volume in the stock.
- Chaikin Money Flow (CMF): The CMF has been positive, indicating that money is flowing into the stock.
Key Observations:
- The trend indicators suggest a bullish sentiment in the stock, supported by the moving averages and MACD.
- Momentum indicators show mixed signals, with RSI indicating overbought conditions and stochastic oscillator signaling a potential reversal.
- Volatility indicators point towards decreasing volatility, which could lead to a period of consolidation.
- Volume indicators indicate consistent buying volume, supporting the bullish outlook.
Conclusion:
Based on the analysis of the technical indicators, the next few days' possible stock price movement for GGM is likely to be upward with a potential for consolidation. Investors should monitor the stochastic oscillator for any signs of a reversal and pay attention to the decreasing volatility indicated by the Bollinger Bands. Overall, the bullish trend supported by the moving averages and MACD suggests a positive outlook for the stock in the near term.