Technical Analysis of GGME 2024-05-10
Overview:
In analyzing the technical indicators for GGME over the last 5 days, we will delve into the trend, momentum, volatility, and volume indicators to provide a comprehensive outlook on the possible stock price movement. By examining these key aspects, we aim to offer valuable insights and predictions for the upcoming days.
Trend Analysis:
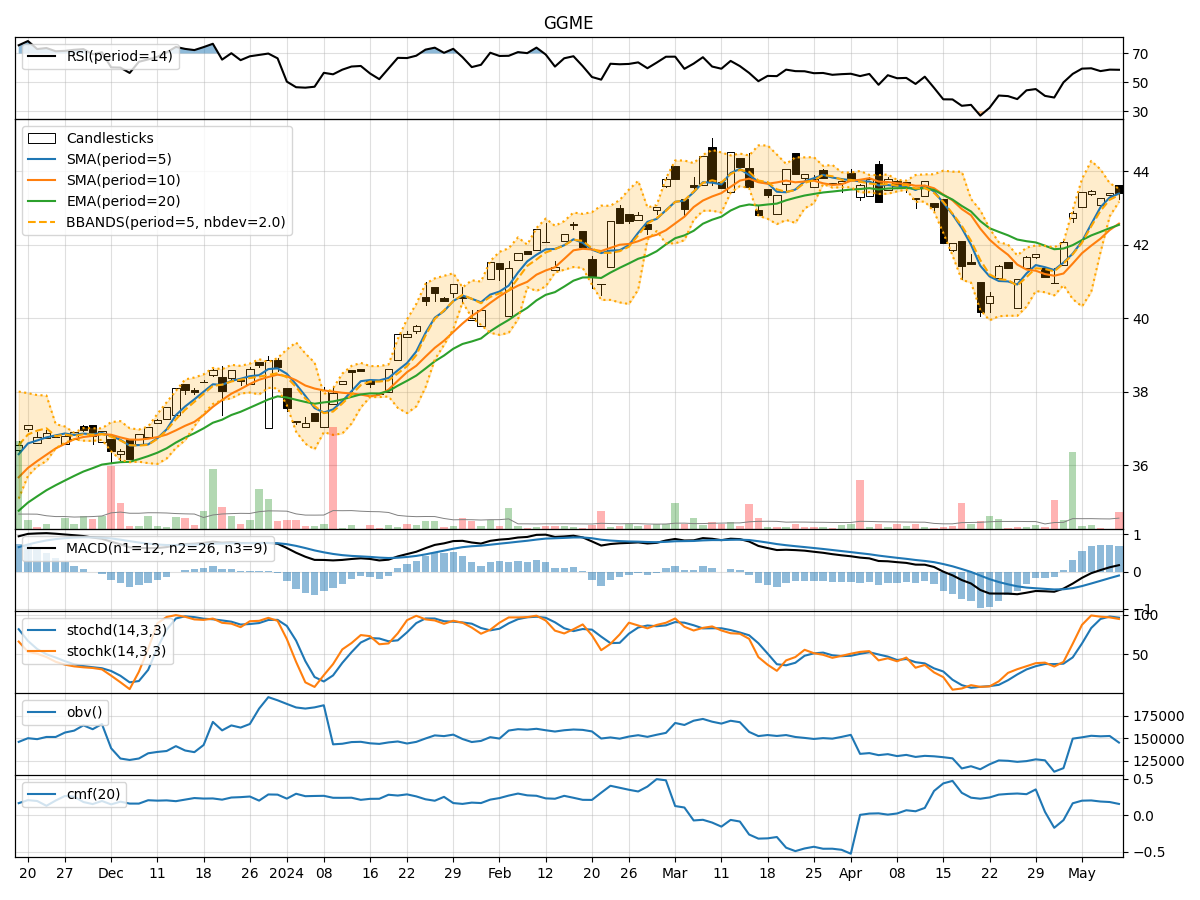
- Moving Averages (MA): The 5-day Moving Average (MA) has been consistently above the Simple Moving Average (SMA) and Exponential Moving Average (EMA), indicating a bullish trend.
- MACD: The MACD line has been consistently above the signal line, with the MACD Histogram showing positive values, suggesting a bullish momentum in the short term.
Momentum Analysis:
- RSI: The Relative Strength Index (RSI) has been hovering around the 60-70 range, indicating a neutral to slightly bullish momentum.
- Stochastic Oscillator: Both %K and %D have been in the overbought territory, suggesting a potential reversal or consolidation phase.
Volatility Analysis:
- Bollinger Bands (BB): The stock price has been trading within the Bollinger Bands, with the bands narrowing, indicating decreasing volatility.
- Bollinger %B: The %B indicator has been fluctuating around the midpoint, suggesting a balanced market sentiment.
Volume Analysis:
- On-Balance Volume (OBV): The OBV has shown mixed signals with fluctuations in volume, indicating indecision among market participants.
- Chaikin Money Flow (CMF): The CMF has been positive but trending downwards, signaling potential distribution.
Key Observations:
- The trend indicators suggest a bullish bias in the short term.
- Momentum indicators show a neutral to slightly bullish sentiment.
- Volatility indicators point towards decreasing volatility.
- Volume indicators reflect mixed signals with a potential distribution phase.
Conclusion:
Based on the analysis of the technical indicators, the next few days for GGME stock price movement could see sideways consolidation with a slight bullish bias. Traders should closely monitor key support and resistance levels for potential breakout opportunities. It is advisable to exercise caution and wait for clearer signals before making significant trading decisions.