Technical Analysis of GGRW 2024-05-10
Overview:
In analyzing the technical indicators for GGRW over the last 5 days, we will delve into the trend, momentum, volatility, and volume indicators to provide a comprehensive outlook on the possible stock price movement. By examining these key aspects, we aim to offer valuable insights and predictions for the upcoming days.
Trend Analysis:
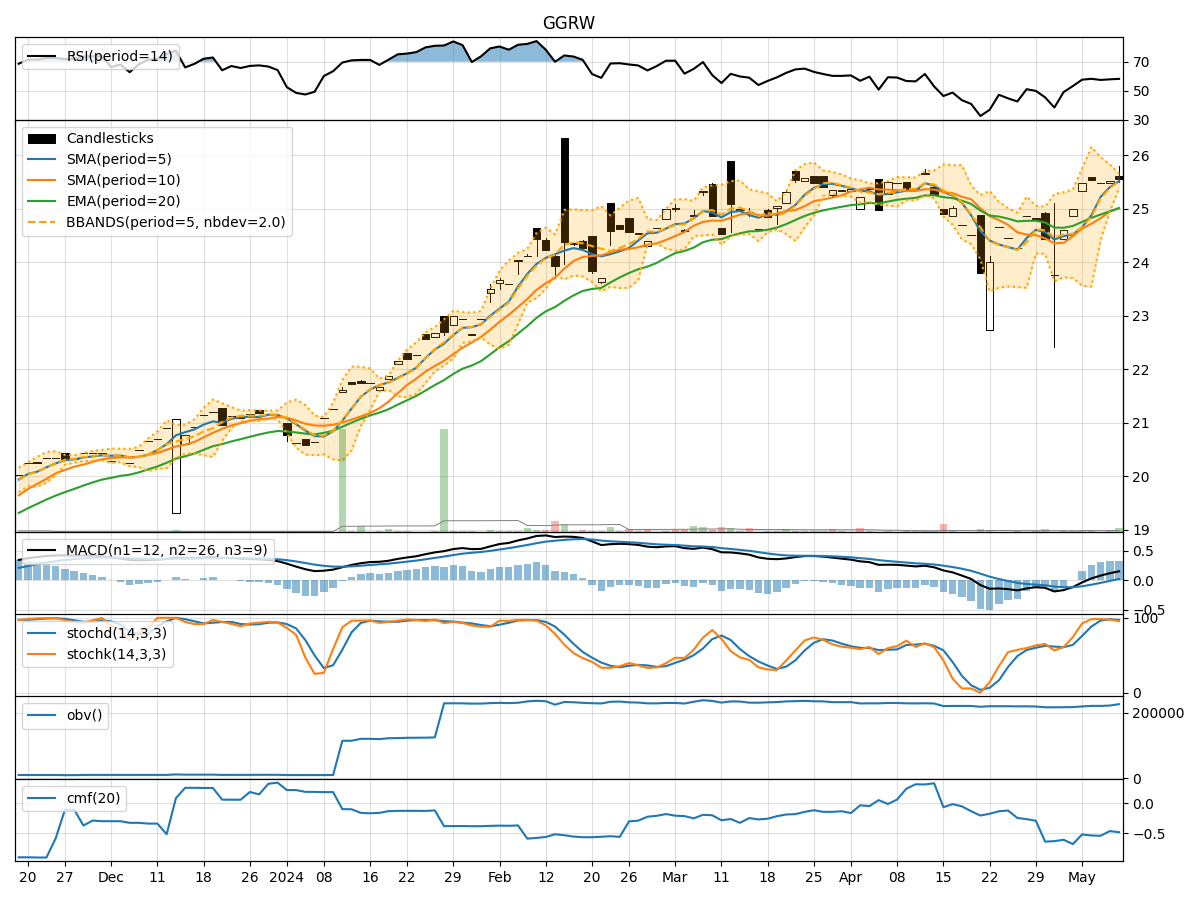
- Moving Averages (MA): The 5-day Moving Average (MA) has been consistently above the Simple Moving Average (SMA) and Exponential Moving Average (EMA), indicating a bullish trend.
- MACD: The MACD line has been consistently above the signal line, with the MACD histogram showing an increasing positive trend, suggesting bullish momentum.
Momentum Analysis:
- RSI: The Relative Strength Index (RSI) has been hovering around the mid-level, indicating neutral momentum.
- Stochastic Oscillator: Both %K and %D have been relatively high, suggesting overbought conditions.
- Williams %R: The Williams %R is in the oversold territory, indicating a potential reversal.
Volatility Analysis:
- Bollinger Bands (BB): The stock price has been trading within the Bollinger Bands, with the bands narrowing, indicating decreasing volatility.
- Bollinger %B: The %B indicator is close to 1, suggesting the price is near the upper band, potentially signaling a reversal.
Volume Analysis:
- On-Balance Volume (OBV): The OBV has been declining, indicating selling pressure in the stock.
- Chaikin Money Flow (CMF): The CMF has been negative, suggesting outflow of money from the stock.
Conclusion:
Based on the analysis of the technical indicators: - Trend: The stock is in an upward trend supported by moving averages and MACD. - Momentum: The momentum is mixed, with RSI neutral, Stochastic overbought, and Williams %R oversold. - Volatility: Volatility is decreasing, as indicated by the narrowing Bollinger Bands. - Volume: The volume indicators suggest selling pressure with declining OBV and negative CMF.
Overall View:
Considering the technical indicators, the stock is likely to experience consolidation in the near term, with a potential for a short-term pullback due to overbought conditions in the Stochastic oscillator and selling pressure indicated by volume indicators. Traders should exercise caution and consider waiting for a clearer signal before making trading decisions.