Technical Analysis of GGUS 2024-05-10
Overview:
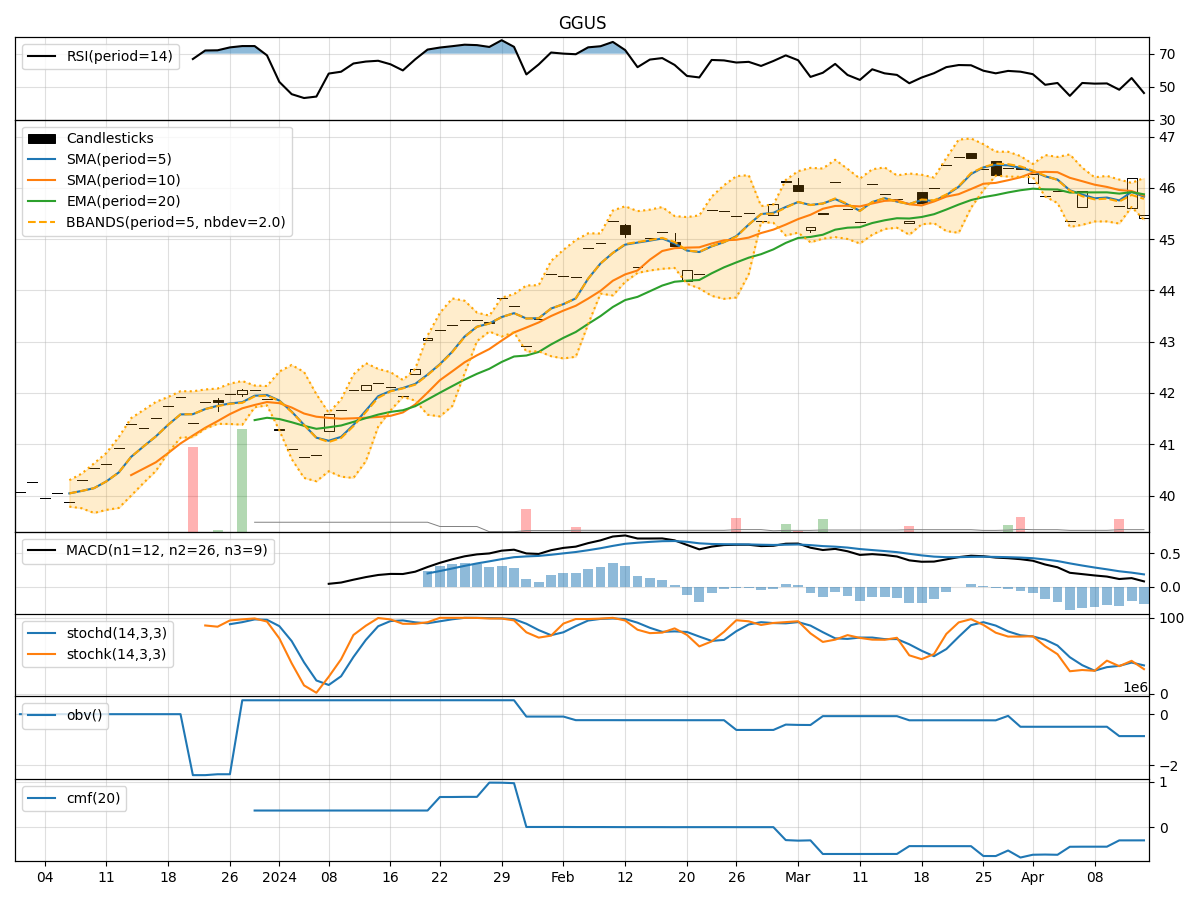
In analyzing the technical indicators for GGUS over the last 5 days, we will delve into the trend, momentum, volatility, and volume indicators to provide a comprehensive outlook on the possible stock price movement in the coming days. By examining these key indicators, we aim to offer valuable insights and predictions to guide investment decisions.
Trend Analysis:
- Moving Averages (MA): The 5-day MA has been consistently above the 10-day SMA, indicating a short-term bullish trend.
- Exponential Moving Average (EMA): The EMA has been trending upwards, suggesting a positive momentum in the stock price.
- Moving Average Convergence Divergence (MACD): The MACD line has been above the signal line, signaling a bullish trend.
Key Observation: The trend indicators point towards an upward movement in the stock price.
Momentum Analysis:
- Relative Strength Index (RSI): RSI has been increasing, indicating strengthening momentum.
- Stochastic Oscillator (Stoch): Stochastics have been in the overbought zone, suggesting a potential reversal.
- Williams %R (WillR): WillR has been hovering around the oversold territory, indicating a possible buying opportunity.
Key Observation: The momentum indicators suggest a mixed outlook with potential for a short-term correction.
Volatility Analysis:
- Bollinger Bands (BB): The stock price has been trading within the bands, with narrowing volatility.
- Bollinger Band %B (BBP): BBP has been fluctuating within a narrow range, indicating stable volatility levels.
Key Observation: Volatility indicators point towards a sideways movement with low volatility.
Volume Analysis:
- On-Balance Volume (OBV): OBV has been fluctuating around the zero line, suggesting a balance between buying and selling pressure.
- Chaikin Money Flow (CMF): CMF has been negative, indicating a net outflow of money from the stock.
Key Observation: Volume indicators reflect a neutral sentiment with balanced trading activity.
Conclusion:
Based on the analysis of trend, momentum, volatility, and volume indicators, the next few days for GGUS are likely to see a continued upward trend in the stock price, supported by positive moving averages and MACD. However, the momentum indicators suggest a potential short-term correction due to overbought conditions. Volatility is expected to remain low with a sideways movement, while volume indicators indicate a neutral sentiment.
Overall Assessment: The stock is likely to experience upward momentum in the near term, but investors should be cautious of a possible short-term correction. It is advisable to closely monitor the price action and key support/resistance levels for timely decision-making.