Technical Analysis of GHEE 2024-05-10
Overview:
In analyzing the technical indicators for GHEE stock over the last 5 days, we will delve into the trend, momentum, volatility, and volume indicators to provide a comprehensive outlook on the possible future stock price movement. By examining these key indicators, we aim to offer valuable insights and predictions for the upcoming trading days.
Trend Analysis:
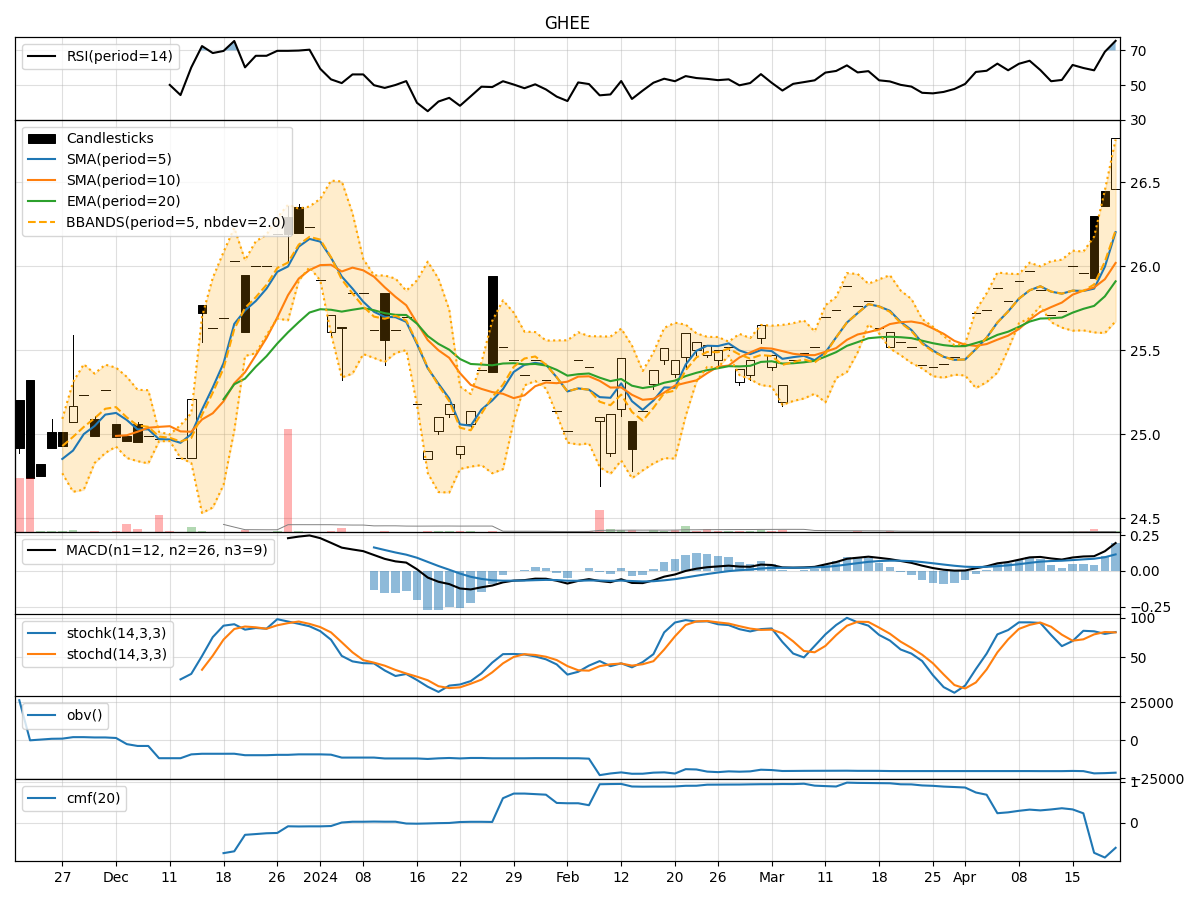
- Moving Averages (MA): The 5-day Moving Average (MA) has been fluctuating around the closing prices, indicating short-term price trends. The Simple Moving Average (SMA) and Exponential Moving Average (EMA) have shown slight upward movements, suggesting a potential bullish sentiment.
- MACD: The Moving Average Convergence Divergence (MACD) has been positive, with the MACD line consistently above the signal line. This signals a bullish trend in the stock price.
- Conclusion: The trend indicators suggest an upward momentum in the stock price.
Momentum Analysis:
- RSI: The Relative Strength Index (RSI) has been gradually increasing, reaching above 50 on the last trading day. This indicates strengthening buying pressure.
- Stochastic Oscillator: Both %K and %D have been rising, with %K crossing above %D, signaling a potential bullish momentum.
- Conclusion: The momentum indicators point towards a bullish sentiment in the stock.
Volatility Analysis:
- Bollinger Bands (BB): The Bollinger Bands have been narrowing, indicating decreasing volatility in the stock price. The bands are relatively close to the moving average, suggesting a period of consolidation.
- Conclusion: The volatility indicators suggest a consolidation phase in the stock price.
Volume Analysis:
- On-Balance Volume (OBV): The OBV has remained constant over the last 5 days, indicating a balance between buying and selling pressure.
- Chaikin Money Flow (CMF): The CMF has been negative, reflecting a slight outflow of money from the stock.
- Conclusion: The volume indicators suggest a neutral stance in terms of buying and selling pressure.
Overall Conclusion:
Based on the analysis of trend, momentum, volatility, and volume indicators, the overall outlook for GHEE stock in the next few days is as follows: - Trend: The trend indicators point towards an upward momentum in the stock price. - Momentum: The momentum indicators suggest a bullish sentiment in the stock. - Volatility: The volatility indicators indicate a consolidation phase in the stock price. - Volume: The volume indicators reflect a neutral stance in terms of buying and selling pressure.
Final Recommendation:
Considering the collective analysis of the technical indicators, it is likely that GHEE stock will experience further upward movement in the next few days. Traders and investors may consider taking advantage of this potential bullish trend by monitoring the price action closely and considering entry positions accordingly.