Technical Analysis of GHTA 2024-05-10
Overview:
In analyzing the technical indicators for GHTA over the last 5 days, we will delve into the trend, momentum, volatility, and volume indicators to provide a comprehensive outlook on the possible stock price movement. By examining these key aspects, we aim to offer valuable insights and predictions for the upcoming days.
Trend Indicators:
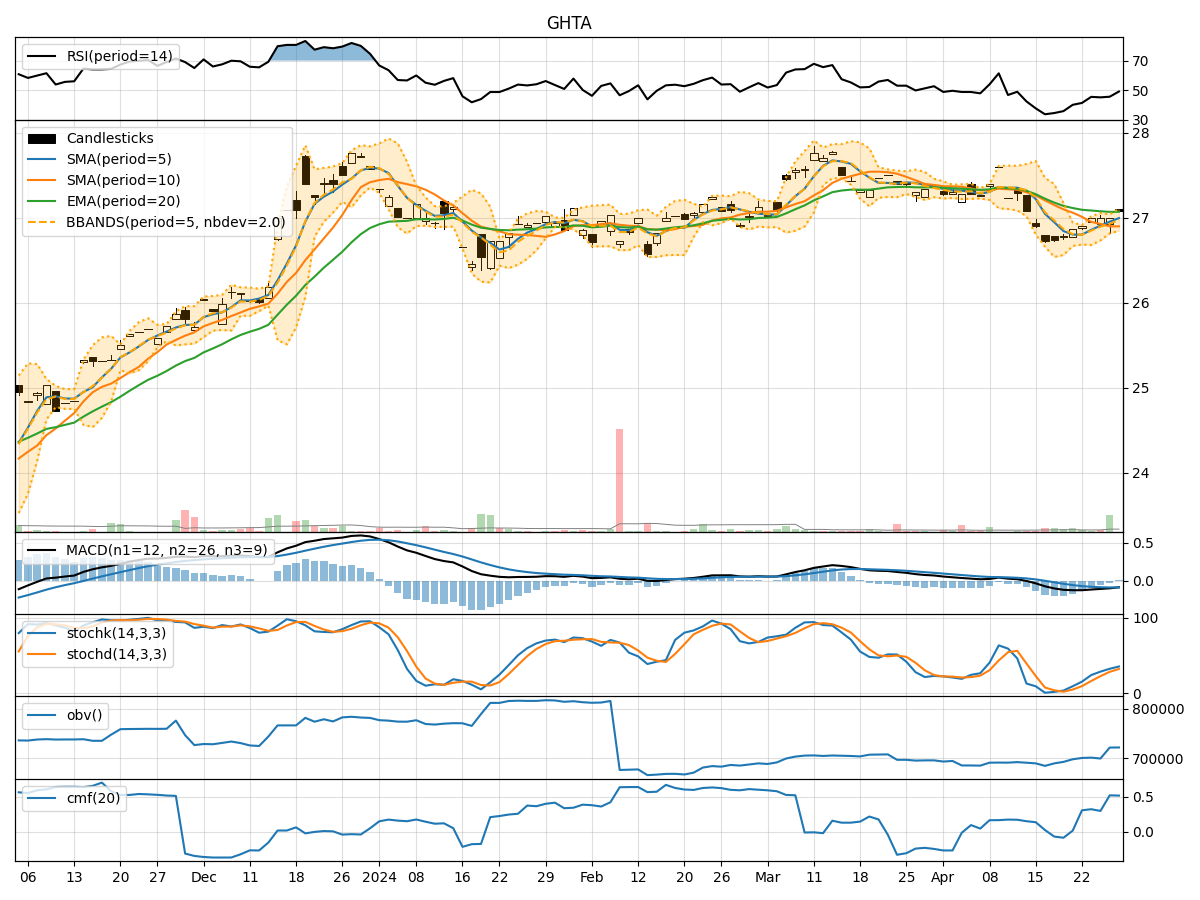
- Moving Averages (MA): The 5-day MA has been consistently above the closing prices, indicating a bullish trend.
- MACD: The MACD line has been above the signal line, suggesting a bullish momentum.
- RSI: The RSI values have been fluctuating around the overbought territory, indicating strong buying pressure.
Momentum Indicators:
- Stochastic Oscillator: The Stochastic Oscillator has been in the overbought zone, suggesting a potential reversal or consolidation.
- Williams %R: The Williams %R has been hovering around the oversold territory, indicating a possible buying opportunity.
Volatility Indicators:
- Bollinger Bands: The stock price has been trading within the Bollinger Bands, indicating a period of consolidation.
- Volatility: The volatility has been relatively stable, suggesting a lack of significant price movements.
Volume Indicators:
- On-Balance Volume (OBV): The OBV has been relatively flat, indicating a balance between buying and selling pressure.
- Chaikin Money Flow (CMF): The CMF has been positive, suggesting a net inflow of money into the stock.
Key Observations:
- The trend indicators point towards a bullish sentiment, supported by the moving averages and MACD.
- Momentum indicators show conflicting signals, with the Stochastic Oscillator in the overbought zone and Williams %R in the oversold territory.
- Volatility indicators suggest a period of consolidation, with the stock price trading within the Bollinger Bands.
- Volume indicators indicate a balanced buying and selling pressure, with a slight positive bias in the Chaikin Money Flow.
Conclusion:
Based on the analysis of the technical indicators, the next few days for GHTA could see sideways movement or consolidation as the stock price continues to trade within a tight range. The conflicting signals from the momentum indicators suggest a potential tug of war between buyers and sellers, leading to a lack of clear direction in the short term. Traders may need to exercise caution and wait for a clearer trend to emerge before making significant trading decisions.