Technical Analysis of GHYB 2024-05-10
Overview:
In analyzing the technical indicators for GHYB over the last 5 days, we will delve into the trend, momentum, volatility, and volume indicators to provide a comprehensive assessment of the stock's potential price movement. By examining these key factors, we aim to offer valuable insights and predictions for the next few days.
Trend Analysis:
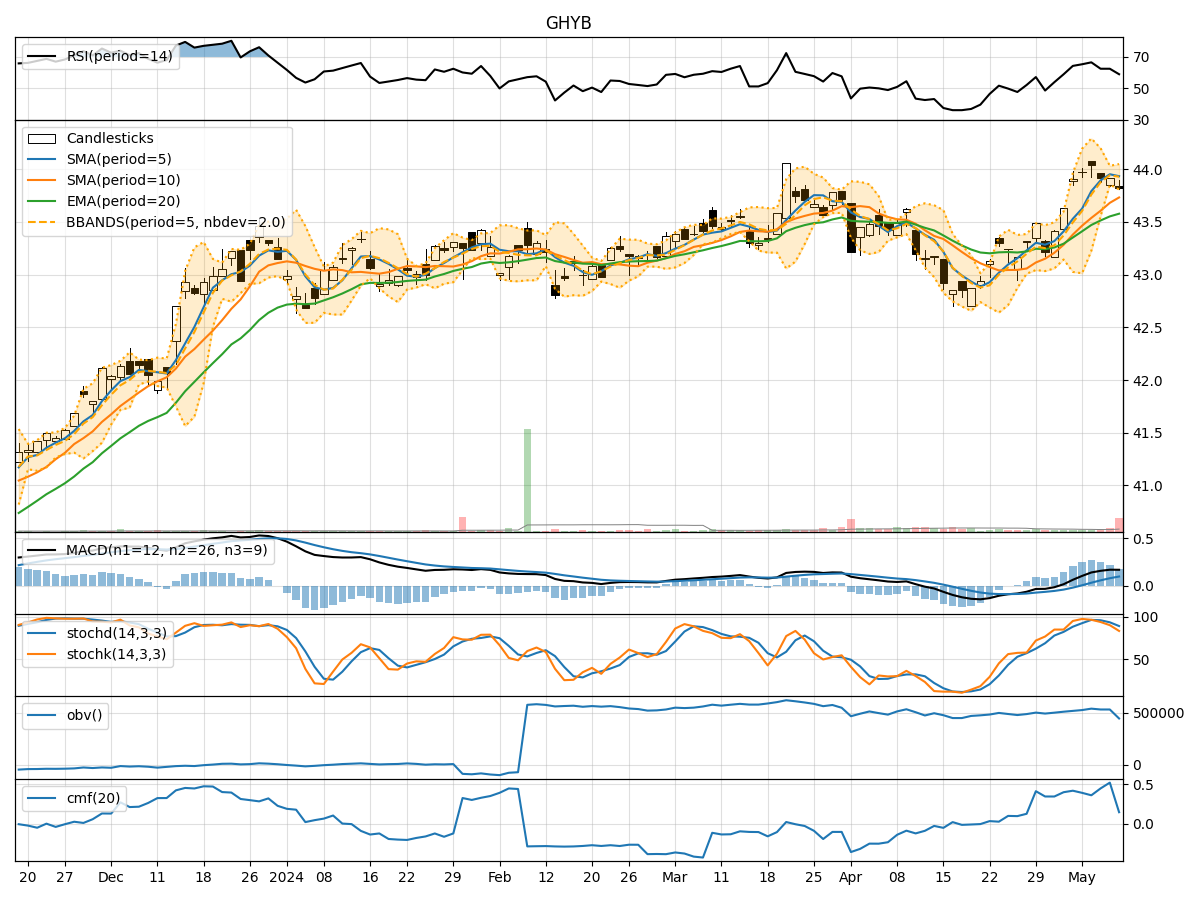
- Moving Averages (MA): The 5-day MA has been consistently above the 10-day SMA, indicating a short-term bullish trend.
- Exponential Moving Average (EMA): The EMA has been trending upwards, suggesting a positive momentum in the stock price.
- Moving Average Convergence Divergence (MACD): The MACD and signal line have been in positive territory, indicating a bullish trend.
Key Observation: The trend indicators suggest an upward momentum in the stock price.
Momentum Analysis:
- Relative Strength Index (RSI): The RSI has been fluctuating around the 60-70 range, indicating a neutral momentum.
- Stochastic Oscillator: Both %K and %D have been gradually decreasing, signaling a potential reversal in momentum.
- Williams %R (Willams %R): The Williams %R is in oversold territory, suggesting a possible buying opportunity.
Key Observation: The momentum indicators show a neutral to slightly bearish sentiment.
Volatility Analysis:
- Bollinger Bands (BB): The stock price has been trading within the bands, indicating a stable price movement.
- Bollinger Band Width (BBW): The BBW has been narrowing, suggesting a decrease in volatility.
Key Observation: The volatility indicators point towards a sideways movement in the stock price.
Volume Analysis:
- On-Balance Volume (OBV): The OBV has been relatively stable, indicating a balance between buying and selling pressure.
- Chaikin Money Flow (CMF): The CMF has been fluctuating, reflecting mixed sentiment among investors.
Key Observation: The volume indicators suggest a neutral outlook for the stock.
Conclusion:
Based on the analysis of trend, momentum, volatility, and volume indicators, the overall outlook for GHYB in the next few days is as follows: - Trend: Upward - Momentum: Neutral to slightly bearish - Volatility: Sideways - Volume: Neutral
Recommendation:
Considering the mixed signals from the technical indicators, it is advisable to exercise caution when making trading decisions on GHYB in the next few days. Traders may consider waiting for more clarity in momentum indicators before taking significant positions. It is essential to monitor the stock closely for any potential shifts in market sentiment that could impact price movements.