Technical Analysis of GIGB 2024-05-10
Overview:
In analyzing the technical indicators for GIGB over the last 5 days, we will delve into the trend, momentum, volatility, and volume indicators to provide a comprehensive outlook on the possible stock price movement in the coming days. By examining these key aspects, we aim to offer valuable insights and recommendations for potential investors.
Trend Indicators:
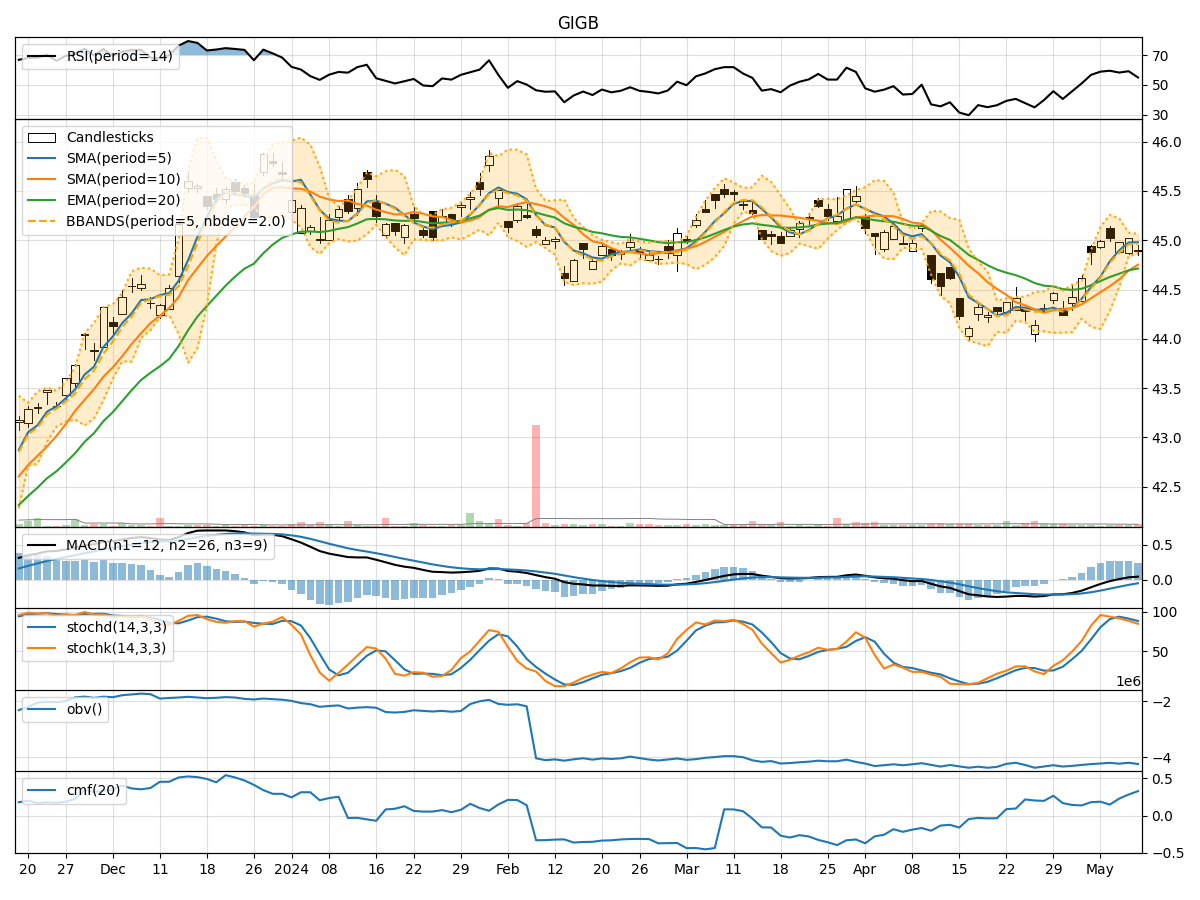
- Moving Averages (MA): The 5-day Moving Average (MA) has been consistently above the Simple Moving Average (SMA) and Exponential Moving Average (EMA), indicating a short-term uptrend.
- MACD: The MACD line has been consistently above the signal line, with both lines showing an upward trend, suggesting bullish momentum.
- MACD Histogram: The MACD Histogram has been positive and increasing, indicating strengthening bullish momentum.
Momentum Indicators:
- RSI: The Relative Strength Index (RSI) has been fluctuating around the 50 level, indicating a neutral momentum.
- Stochastic Oscillator: Both %K and %D lines of the Stochastic Oscillator have been declining, signaling a potential reversal in momentum.
- Williams %R: The Williams %R is in oversold territory, suggesting a possible upcoming bullish reversal.
Volatility Indicators:
- Bollinger Bands (BB): The stock price has been trading within the Bollinger Bands, with the bands narrowing, indicating decreasing volatility.
- Bollinger %B: The %B indicator is close to 0, suggesting the stock is trading near the lower band, potentially indicating an oversold condition.
Volume Indicators:
- On-Balance Volume (OBV): The OBV has been relatively stable, indicating a balance between buying and selling pressure.
- Chaikin Money Flow (CMF): The CMF has been positive and increasing, suggesting a bullish money flow into the stock.
Key Observations and Opinions:
- Trend: The trend indicators suggest a short-term bullish bias, supported by the moving averages and MACD analysis.
- Momentum: The momentum indicators show mixed signals, with RSI neutral, Stochastic indicating a potential reversal, and Williams %R signaling a bullish reversal.
- Volatility: Volatility has been decreasing, potentially indicating a period of consolidation or a calm before a potential price movement.
- Volume: The volume indicators show a balanced buying and selling pressure, with a positive money flow into the stock.
Conclusion:
Based on the analysis of the technical indicators, the next few days' possible stock price movement for GIGB could be sideways consolidation with a slight bullish bias. Investors should closely monitor the Stochastic Oscillator for a potential momentum reversal and the Bollinger Bands for any breakout signals. Additionally, keeping an eye on the OBV and CMF for any shifts in buying or selling pressure would be beneficial in making informed trading decisions.